
Activity
Table of Contents:
Instructions:
- Tapping on the Activity redirects to the Activity page.
- Activity section can be viewed by three timelines- Day, Week and Month, by default Day is selected
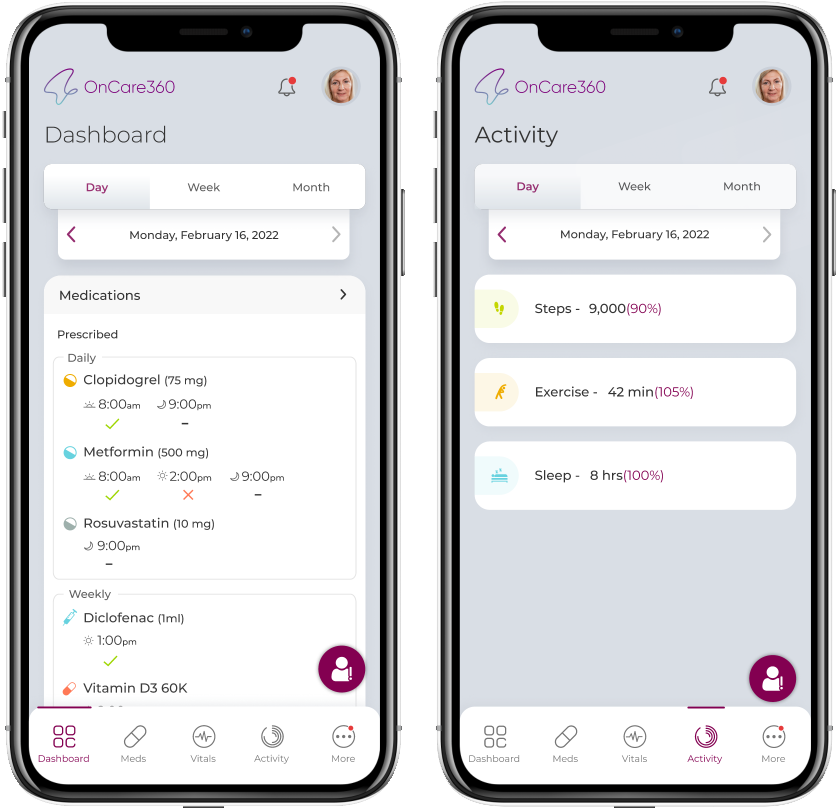
- Below the timeline tab, Activity card for Steps, Exercise and Sleep are available and each cards timeline calculation will be different.
Activity View
- Activity - Day view - Shows Steps count, Exercise mins completed, and sleep hours and the target percentage completed for selected day.
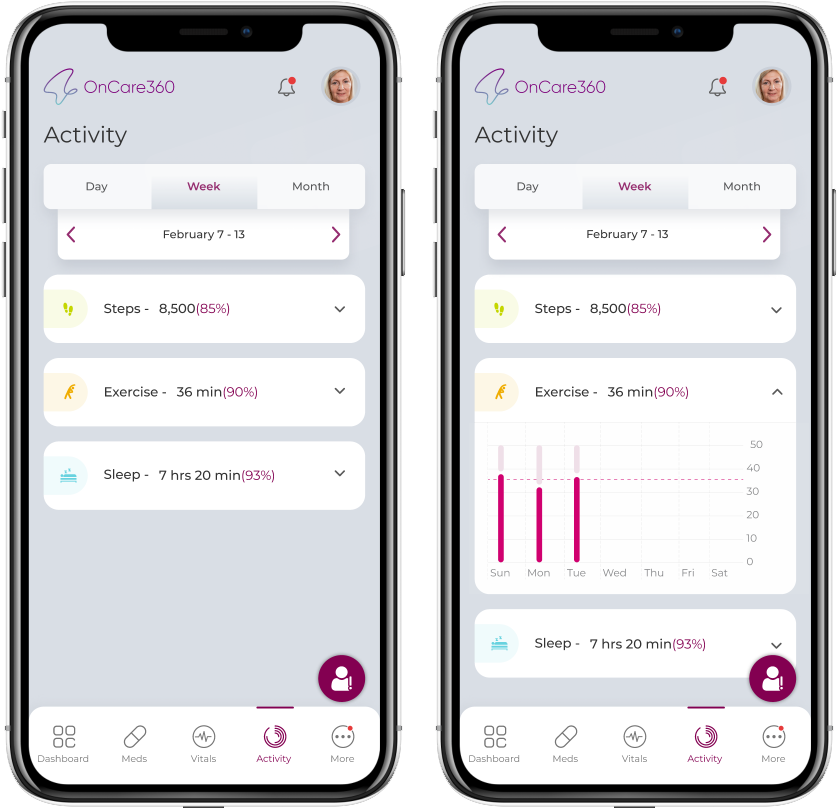
- Activity - Week view - Shows Steps count, Exercise mins completed, and sleep hours and the target percentage completed for selected week. Numbers are added of each parameter for all week days and the values are displayed.
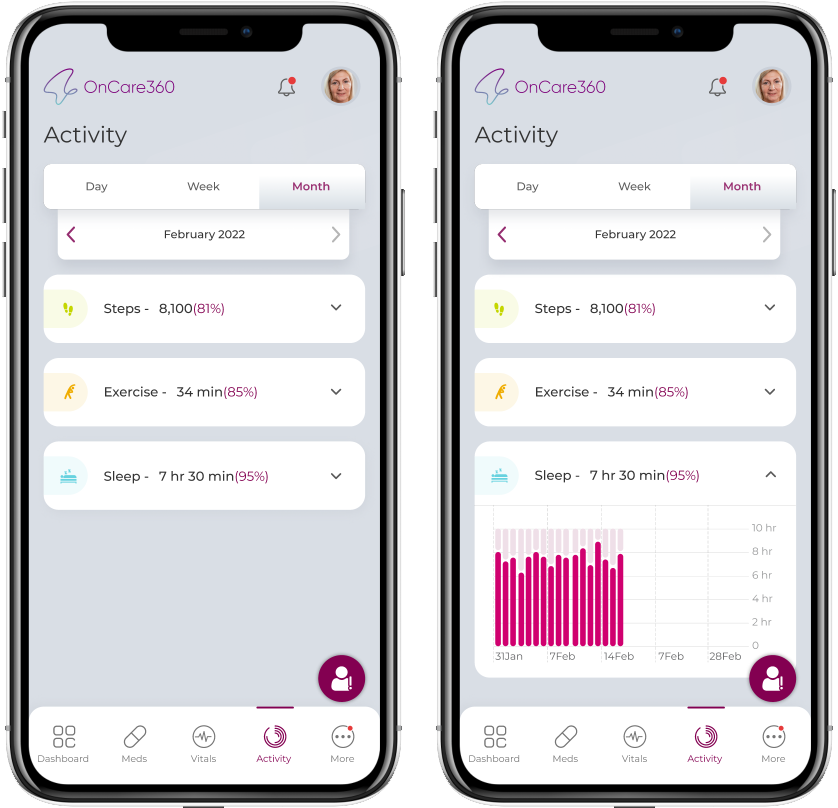
- Activity - Month view - Shows Steps count, Exercise mins completed, and sleep hours and the target percentage completed for selected month. Numbers are added of each parameter for all days in the month and the values are displayed.
- Tapping on the Activity card parameter will display a histogram chart showing the activities on the graph for week and month. (X- axis shows dates/weeks/month based on timeline selection and Y axis shows parameter values)
- App pull the Steps, Exercise and Sleep data from health tracking apps(Google fit - Android, iHealth - iOS) in the background.
- The percentage is calculated based on the Activity goals for the patient. If you reach your targets for the day, the percentage will be shown as 100%. The percentage differs, when you haven't reached your goals.
Note:
An icon to report ‘Adverse Events’ floats on the screen, tapping on which redirects user to Report Adverse event screen.