
Patient Vital Signs Parameters
Table of Contents:
Instructions:
To view Patient Vital signs parameters, click on the briefcase icon in the Patient's listing - Quick Actions.

You will find an accordion at the top. It can be expanded and closed whenever necessary. By default, the accordion containing patient details will be closed.

Additionally, when you click the expand button, you can view the expanded Patient Details, Diagnosis, Medications, Allergies, and the corresponding Feature tabs, as shown below:

- On the left side, you can also see a call icon next to the Mobile number. This icon is used to call the patient on his cell.
- Please click the Vital Signs Parameters tab to view Patient Vitals. There are five sub-tabs, as follows: Heart Rate, SpO2, Temperature, Blood Pressure, and Weight.
Blood Pressure
- By default, Blood Pressure will be selected and will display the Blood Pressure with minimum and maximum values for the respective patient. For blood pressure, two line charts are shown: one for systolic and one for diastolic.
- You can also view the last 30 days' average, the last 7 days' average, and the latest blood pressure reading.
- Below the graph, you can view the patient’s daily blood pressure readings in a table.

- At the top right, you will find the Critical Alerts and Blood Pressure buttons displayed side by side.
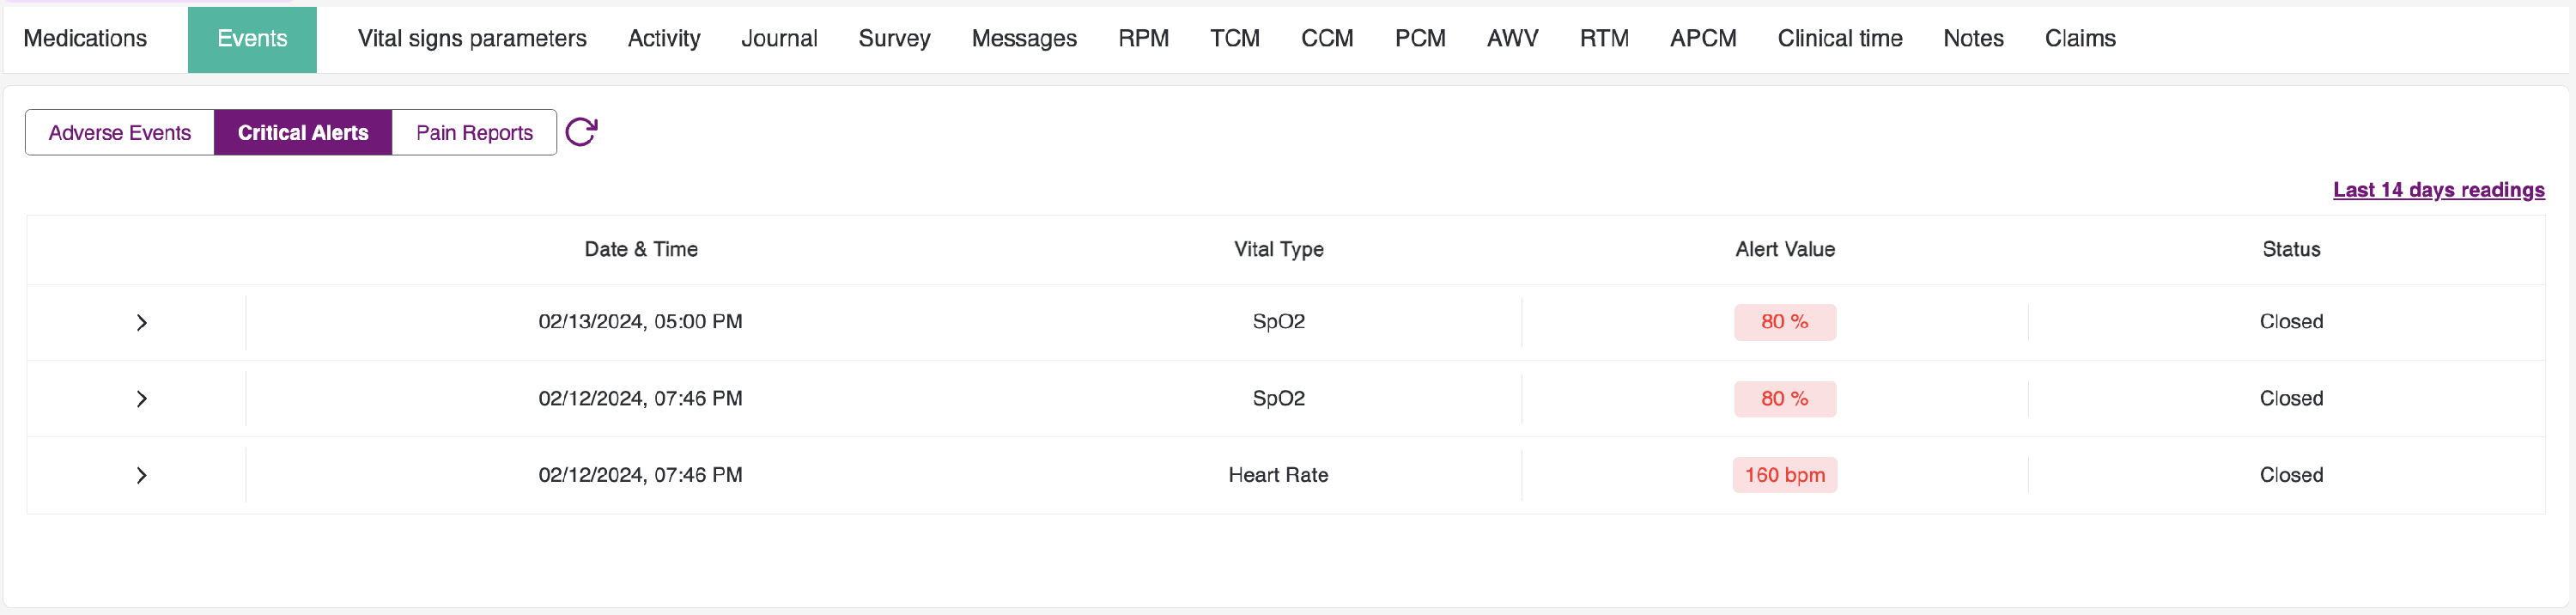
- When you select the Critical Alerts button, you will be directed to the Events tab’s critical alerts sub-tab, where you can view all critical alerts associated with that particular patient.
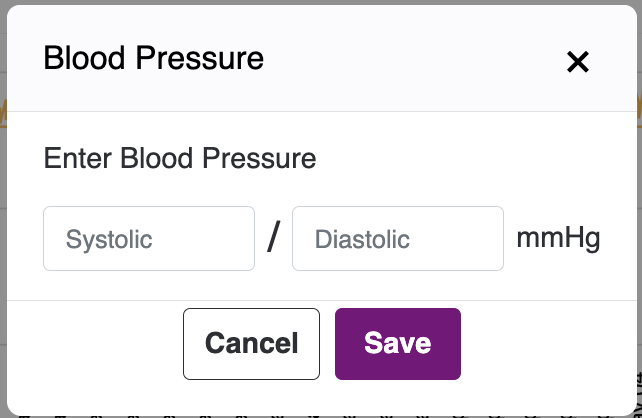
- When you click the Blood Pressure button, you will see a pop-up where you can manually enter your blood pressure readings. After you enter the values, click Submit, and the readings will appear in the table.
Heart Rate
- By default, the Heart Rate tab is active, and these vitals can be viewed using the Daily, Weekly, and Monthly options. You can also adjust the time period by selecting Duration at the top-right.
- You can review the last 30 days' average, the last 7 days' average, as well as the most recent heart-rate reading.
- Under the graph, you will find the patient's daily heart-rate readings displayed in a table.

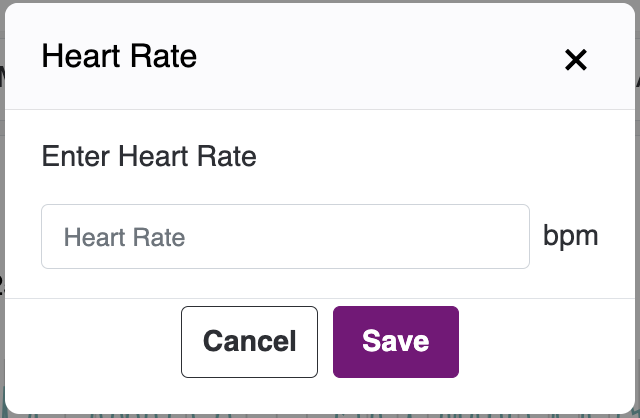
- When you click the Heart Rate button, a pop-up will appear that allows you to manually enter Heart Rate readings. After you enter the values, click Submit, and they will be added to the table.
SpO2
- By clicking the SpO2 tab, you will be able to view the SpO2 percentage along with the Min and Max values for the respective patient.
- You can also review the average SpO2 over the last 30 days, the average over the last 7 days, and the most recent reading.
- Directly below the graph, you can see the patient’s daily SpO2 readings in a table format.

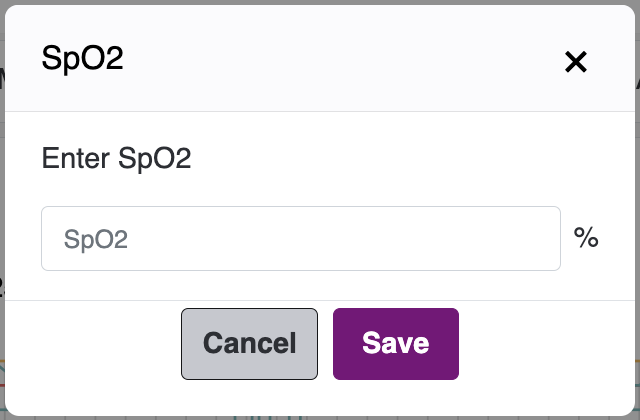
- When you click the SpO2 button, a pop-up will appear that allows you to manually enter the SpO2 readings. After you enter the values, click Submit, and the readings will be added to the table.
Temperature
- By selecting the Temperature tab, you will be able to view the Temperature with Min and Max Values for the respective patient.
- You can also review the last 30 days' average, the last 7 days' average, and the most recent temperature reading.
- Below the graph, you will find a table showing the patient’s daily temperature readings.

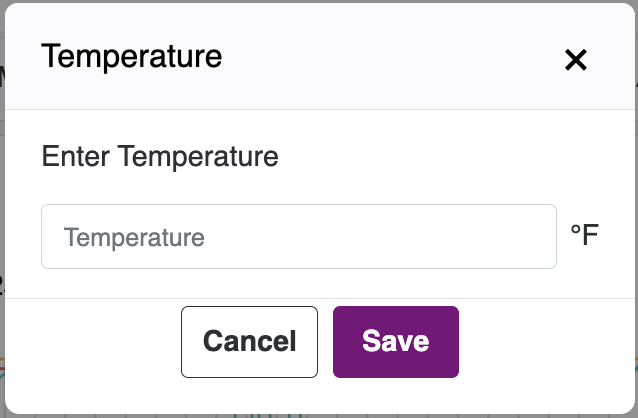
- When you click the Temperature button, a pop-up will appear that allows you to manually enter the temperature readings. After you enter the values, click Submit, and the readings will be added to the table.
Weight
- Select the Weight tab to view the Weight with Min and Max Values for the respective patient. Please note that there are no Min and Max Values available for Weight.
- You can also review the last 30 days’ average, the last 7 days’ average, and the most recent weight reading.
- Directly below the graph, you will find a table that lists the patient’s daily weight readings.

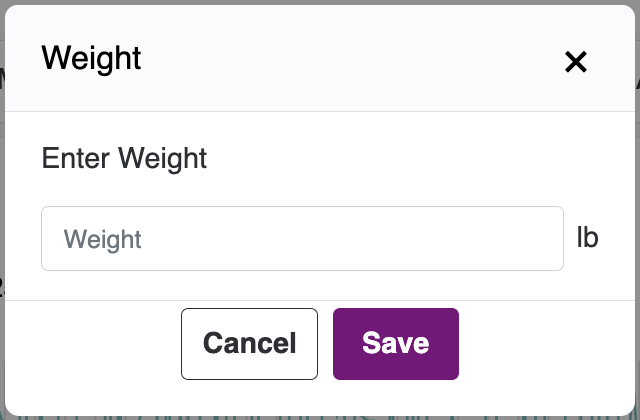
- When you click the Temperature button, a pop-up will appear that allows you to manually enter the temperature readings. After you enter the values, click Submit, and the readings will be added to the table.
Glucose:
- When you click the Glucose tab, the Glucose Values for the respective patient will be displayed. Note that there are no Min and Max Values for Glucose.
- You can also review the average for the last 30 days, the average for the last 7 days, and the most recent Glucose reading.
- Below the graph, you can view the patient’s daily Glucose readings in a table format.

- When you click the Glucose button, a pop-up will appear that allows you to manually enter the Glucose readings. After you enter the values, please click Submit, and the entries will be added to the table.

- You can view today’s vitals on the left side of the chart based on the vital that is selected. For example: if the Heart Rate tab is selected, then Today Bpm is displayed along with Min and Max values. Clicking on each vital displays the histogram line graph for the selected vital.
-
The X-axis updates based on the selection of the Daily, Weekly, and Monthly options. This also depends on the duration range selected. If no duration date is selected, the current days, weeks, and months are displayed.
Daily: The X-axis shows all dates.
Weekly: The X-axis displays data by week (the week start and end dates should be shown).
Monthly: The axis displays data by month.
- The Y-axis changes based on the selected vital type. The Y-axis is dynamic and will adjust to fit the selected vital type.
- After the patient submits vitals, you can view the readings here. If the patient has not submitted any vitals, an empty state will be shown with the message: No Data available.