
Patient Events
Table of Contents:
Instructions
To view events, please click the briefcase icon in the patient’s listing under Quick Actions.

You will find an accordion at the top. It can be expanded or closed as needed. By default, the patient details accordion is closed.
- When you click the expand button, you will be able to view the expanded Patient details as follows. On the left side, you can also see a call icon next to the Mobile number, which is used to call the patient on his cell.
- If the patient is new and is navigating for the first time, he will be directed to the Events tab to view events. These are further categorised into Adverse Events and Pain Reports.
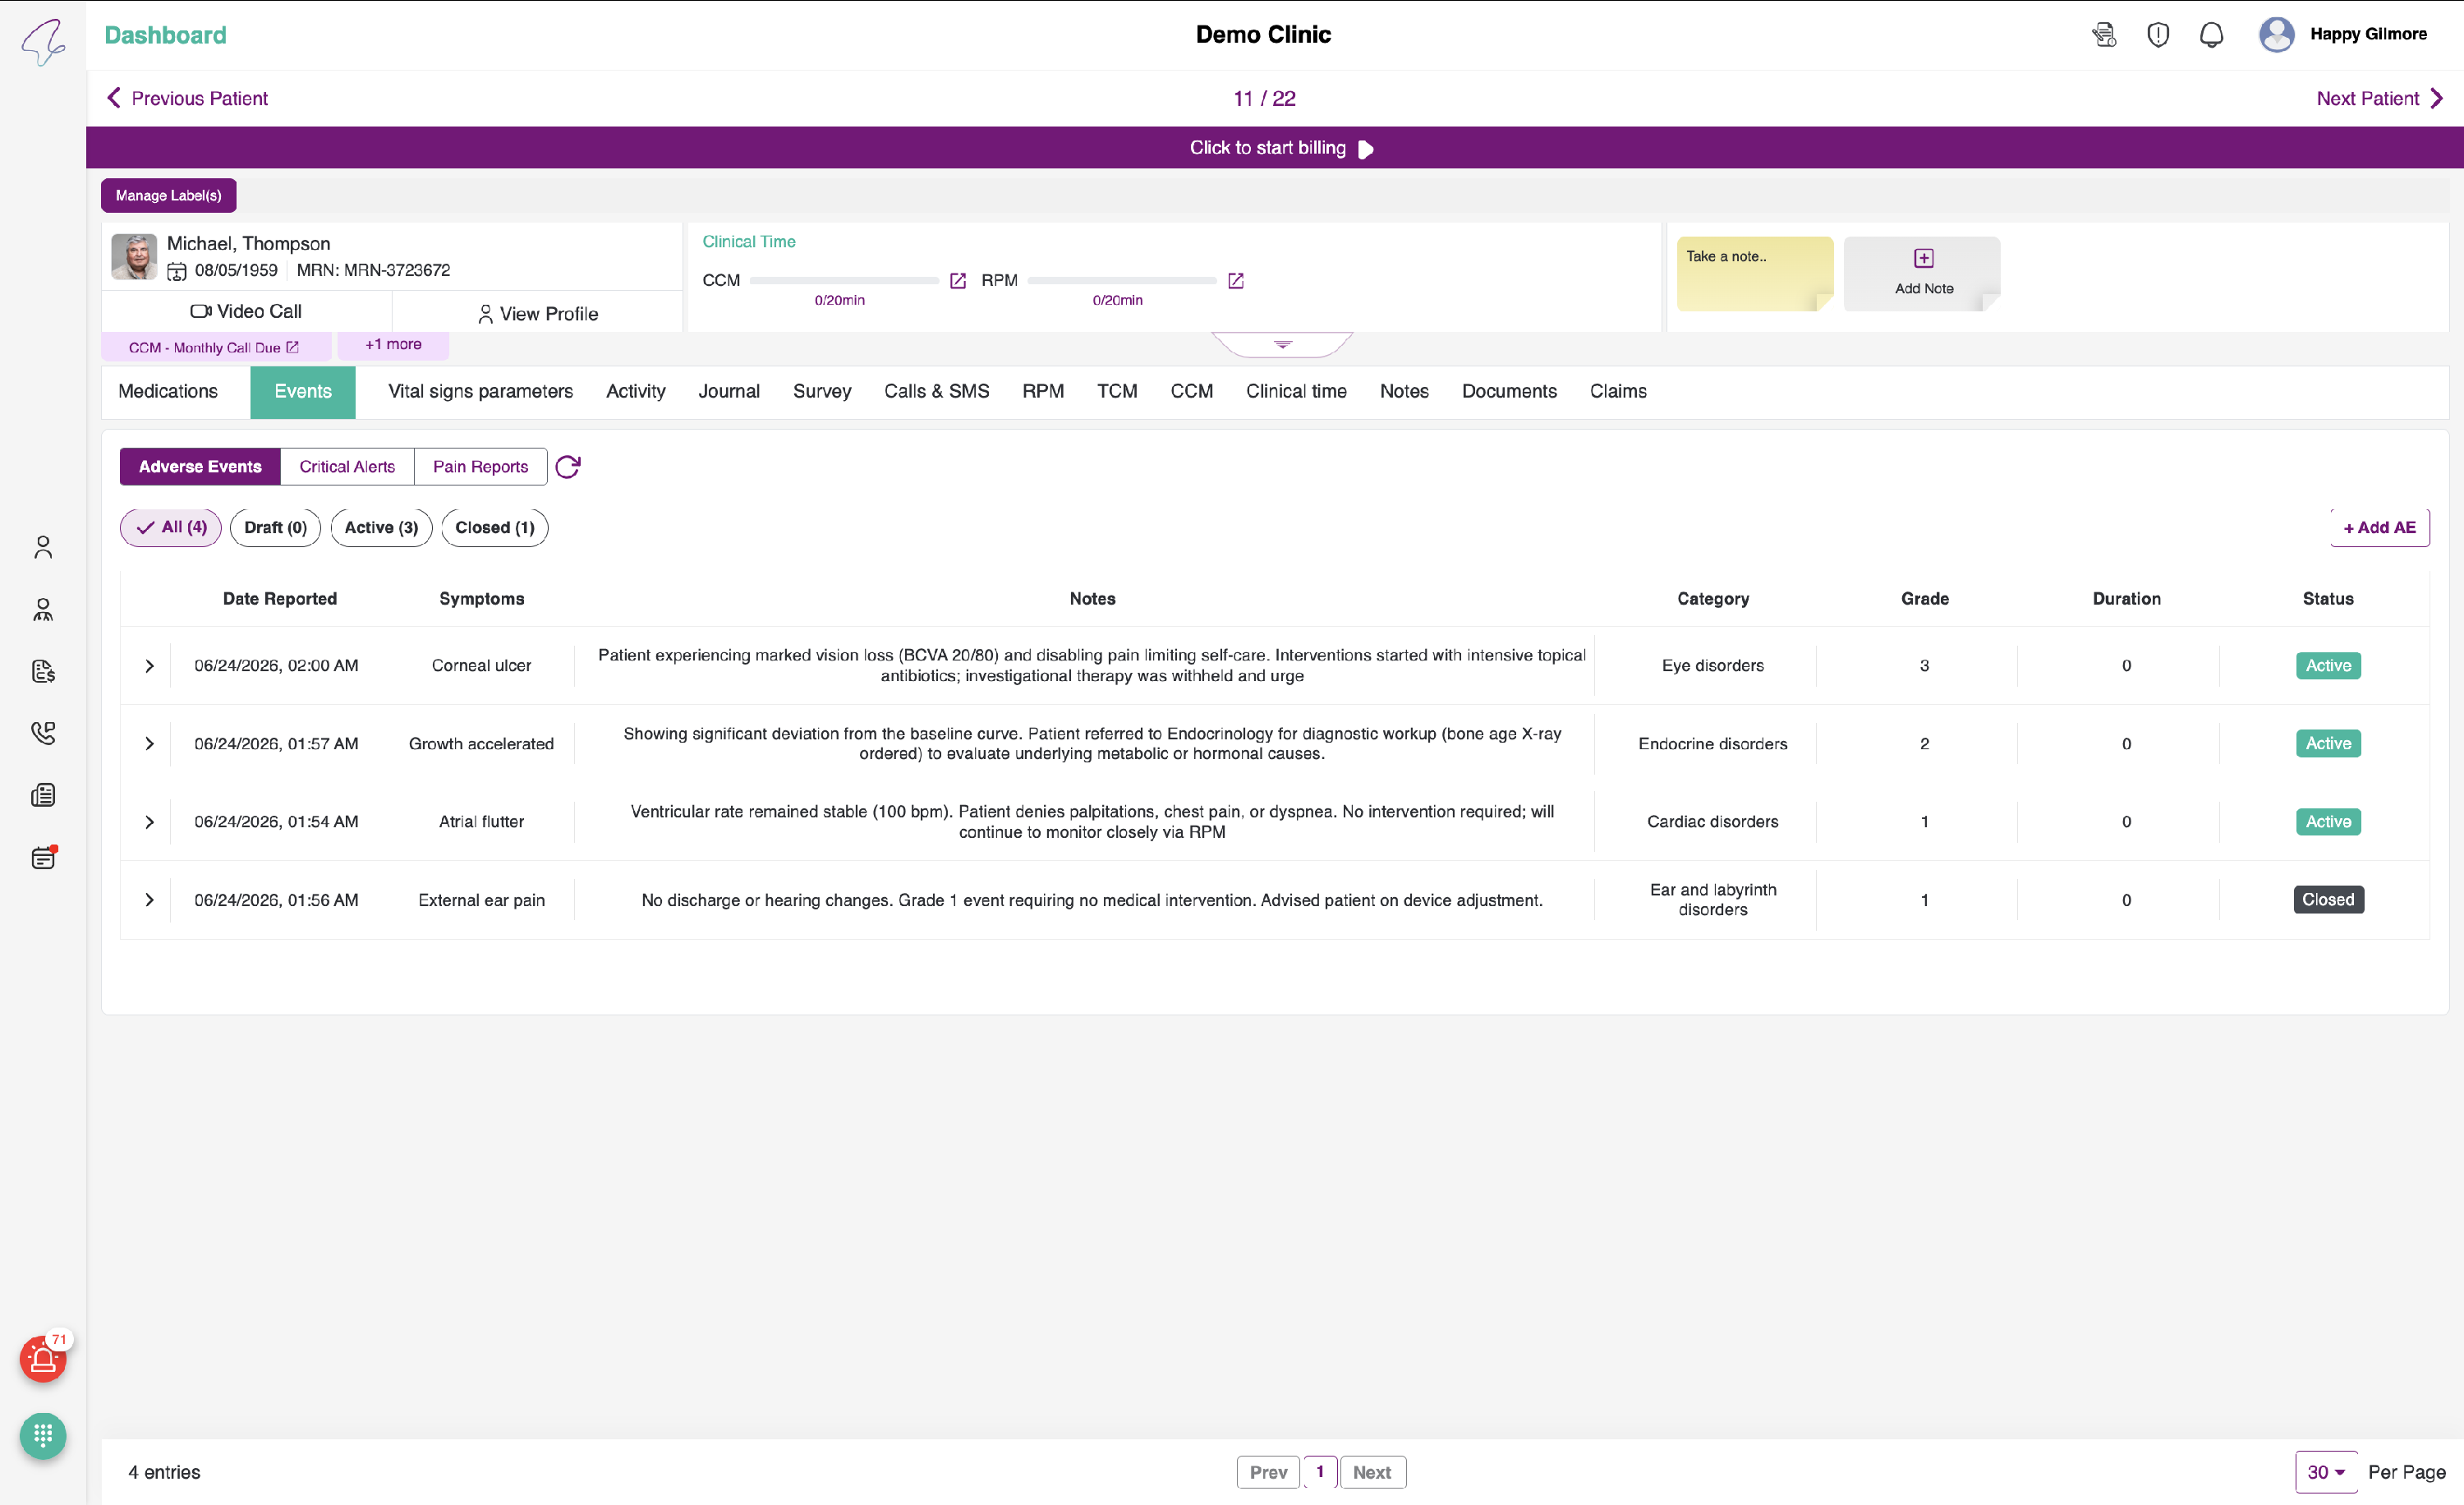
Adverse Events
- You can view an empty state stating: No Adverse Events reported yet.
- By default, you can view the filters and table, which display the details as follows:
- Date Reported - The date on which the patient reports the AE
- Symptoms - Symptoms mentioned by the patient
- Notes - Description of the adverse event the patient has experienced
- Category - The category to which the AE belongs
- Grade - The grade of the AE
- Duration - The length of time the patient experienced the AE
- Status - The status is one of three types: Active, Draft, or Closed
- The filters are as follows:
- All - By default, adverse events will be shown with this filter selected; it displays all adverse event reports
- Draft - Newly reported adverse events appear in the drafts section
- Active - When the adverse event is checked, and the category and grade are updated, it becomes Active
- Closed - Once the adverse event is resolved, the drug is discontinued, or a prescription is added, the AE can be closed
- A new adverse event can be added by clicking the Add AE button on the right. After clicking the button, the Add Adverse Event pop-up will appear as follows.

The pop-up includes the following fields: Date & Time, Category, Symptoms, Grade, and Notes. The Date & Time field will be automatically populated with the current date and time. After completing the other fields, click the Add button to add the adverse event. To cancel the entry, click the Cancel button.
Note:
- Provider added Adverse Events will be saved with the Status Active, which is represented by the blue colour.
- Patient reported Adverse Events will be saved with the Status Draft, which is represented by an amber colour.
Please click on the Draft Adverse Event report. You will then see a “Review Adverse Event” pop-up as follows:

- The pop-up contains the following fields: Date & Time, Category, Symptoms, Grade, and Notes. After completing these fields, click the Update Button to update the Adverse Event. To cancel the review of the Adverse Event, click the Cancel Button.
- After the Category, Symptoms, and Grade are updated for the respective Adverse Event, the status will change to Active.
- You can also add Actions to the Adverse Event. To add actions, click Active Adverse Event. The accordion will appear as shown below.
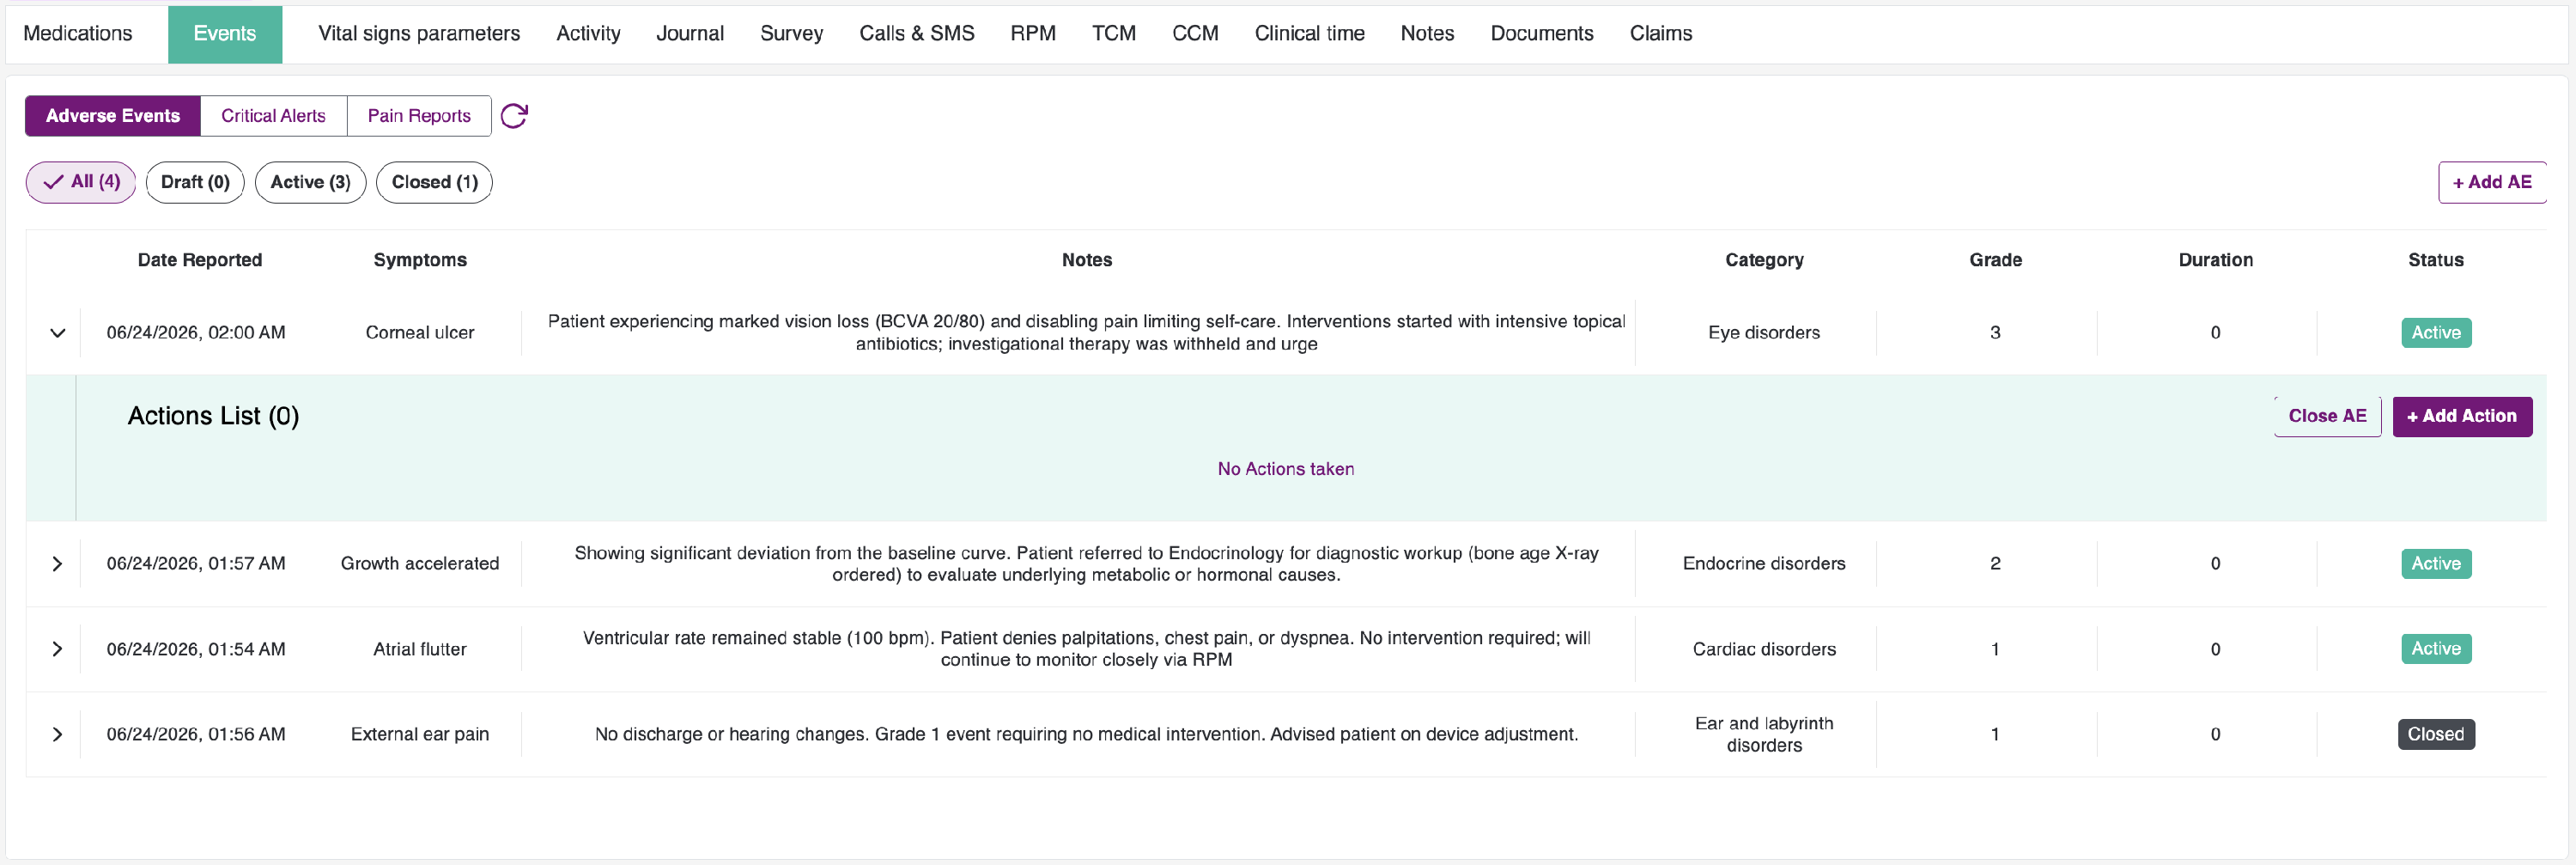
- Because a new Adverse Event will not have any actions, you will see the message displayed: No Actions taken.
- Click the Add Action button, and you will see the Add Action item dialogue as follows:

- The dialog includes the fields: Date & Time, Action, and Notes.
- The Action field provides the following options.
- Phone Call
- Hospital Visit
- Direct
- Other
After selecting the respective action, please add your notes and click the Add Action button on the right. The action will be saved in the Action List as follows:
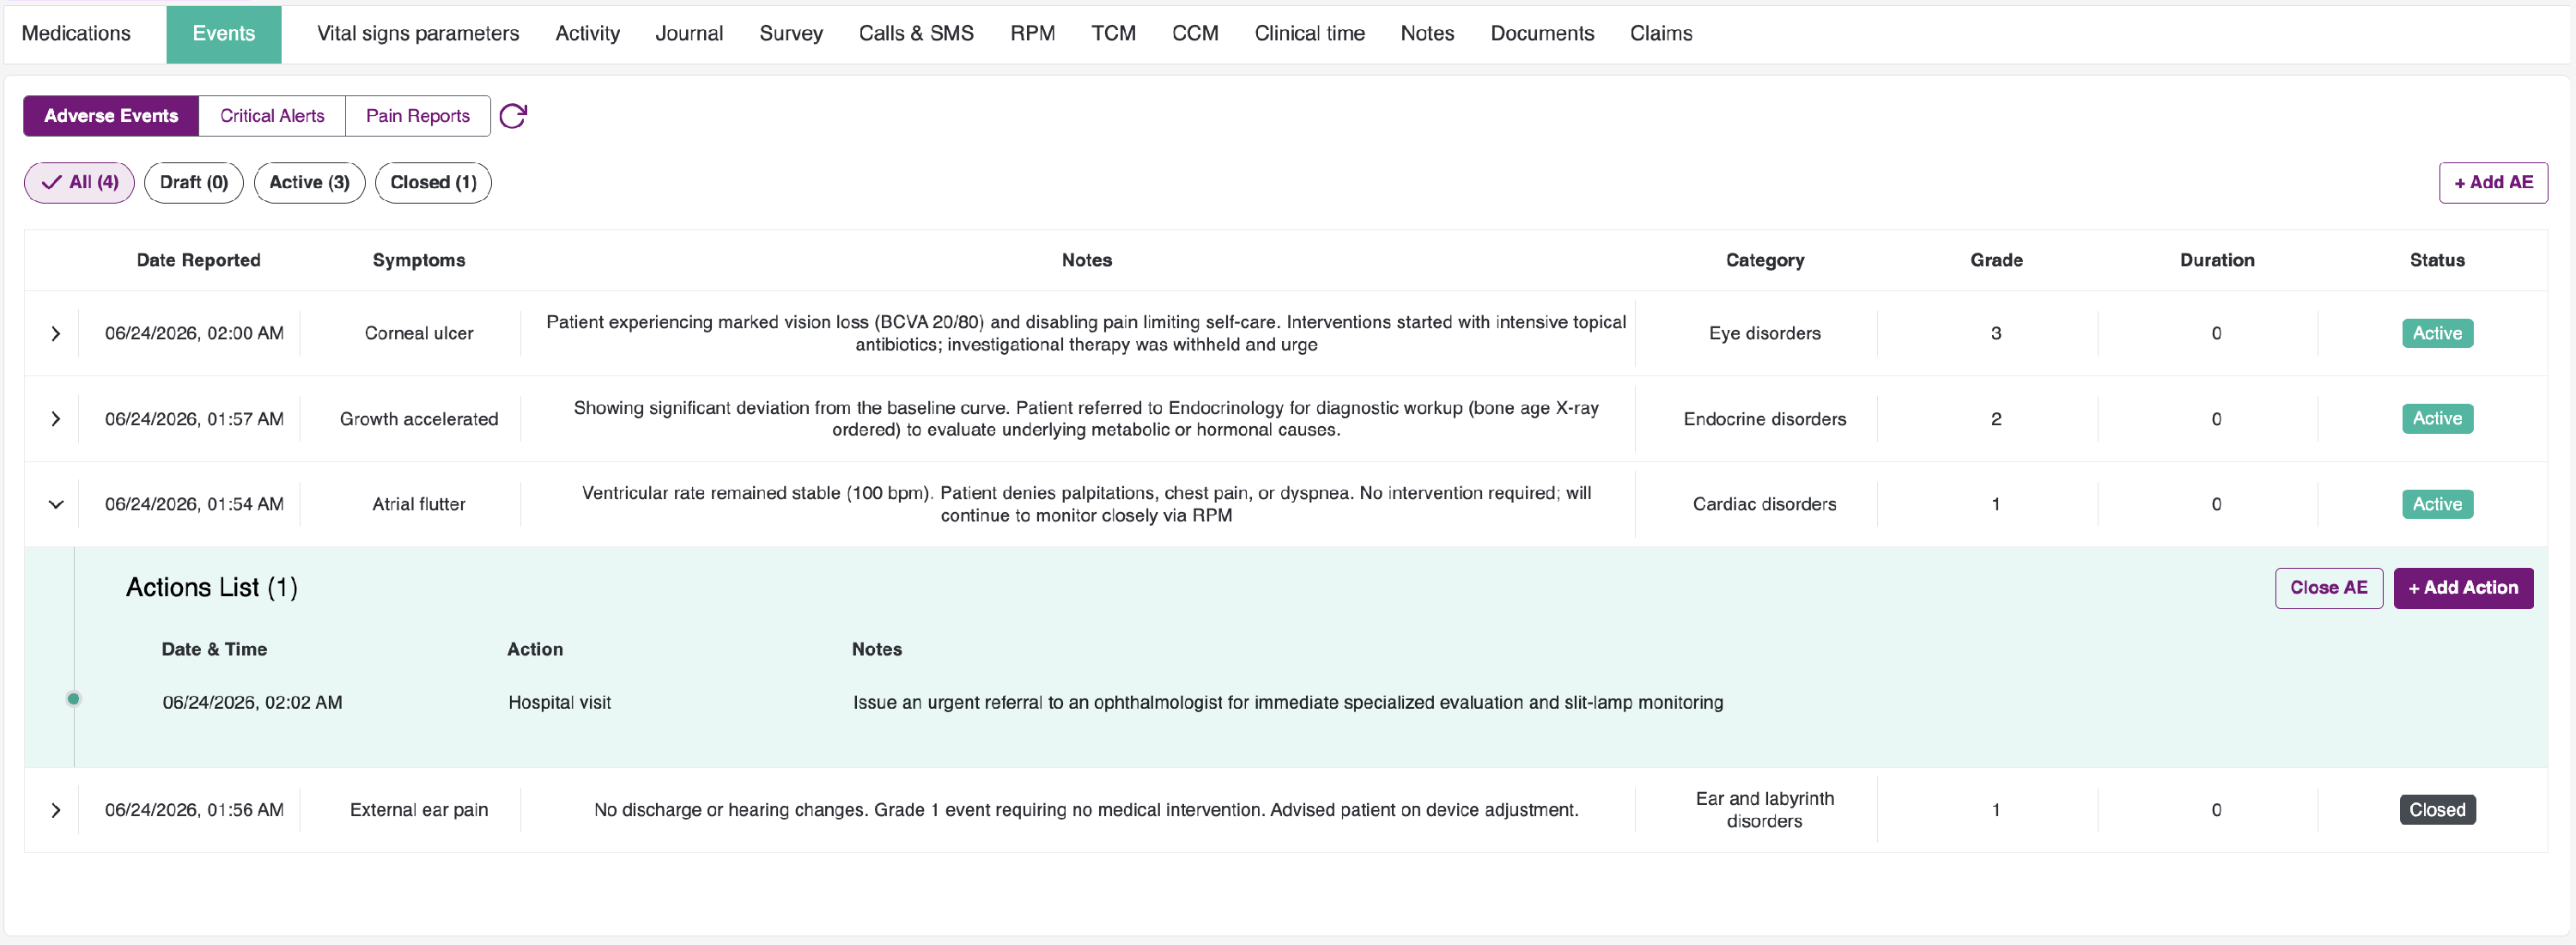
- You can view the action and the date it was added.
- To close an AE, click the Close AE button. This opens the following dialog:

- The “Close Adverse Event” form includes the following fields: Date & Time, Outcome, Notes, and Adverse Event Details.
- When you click Adverse Event Details, you will be able to view additional information for that specific adverse event, as follows:

- After reviewing the AE details, click the Cancel button to cancel the closing of an AE. If you would like to proceed, click the Close AE button.
- You will be able to view the Closure note for the Adverse Event.
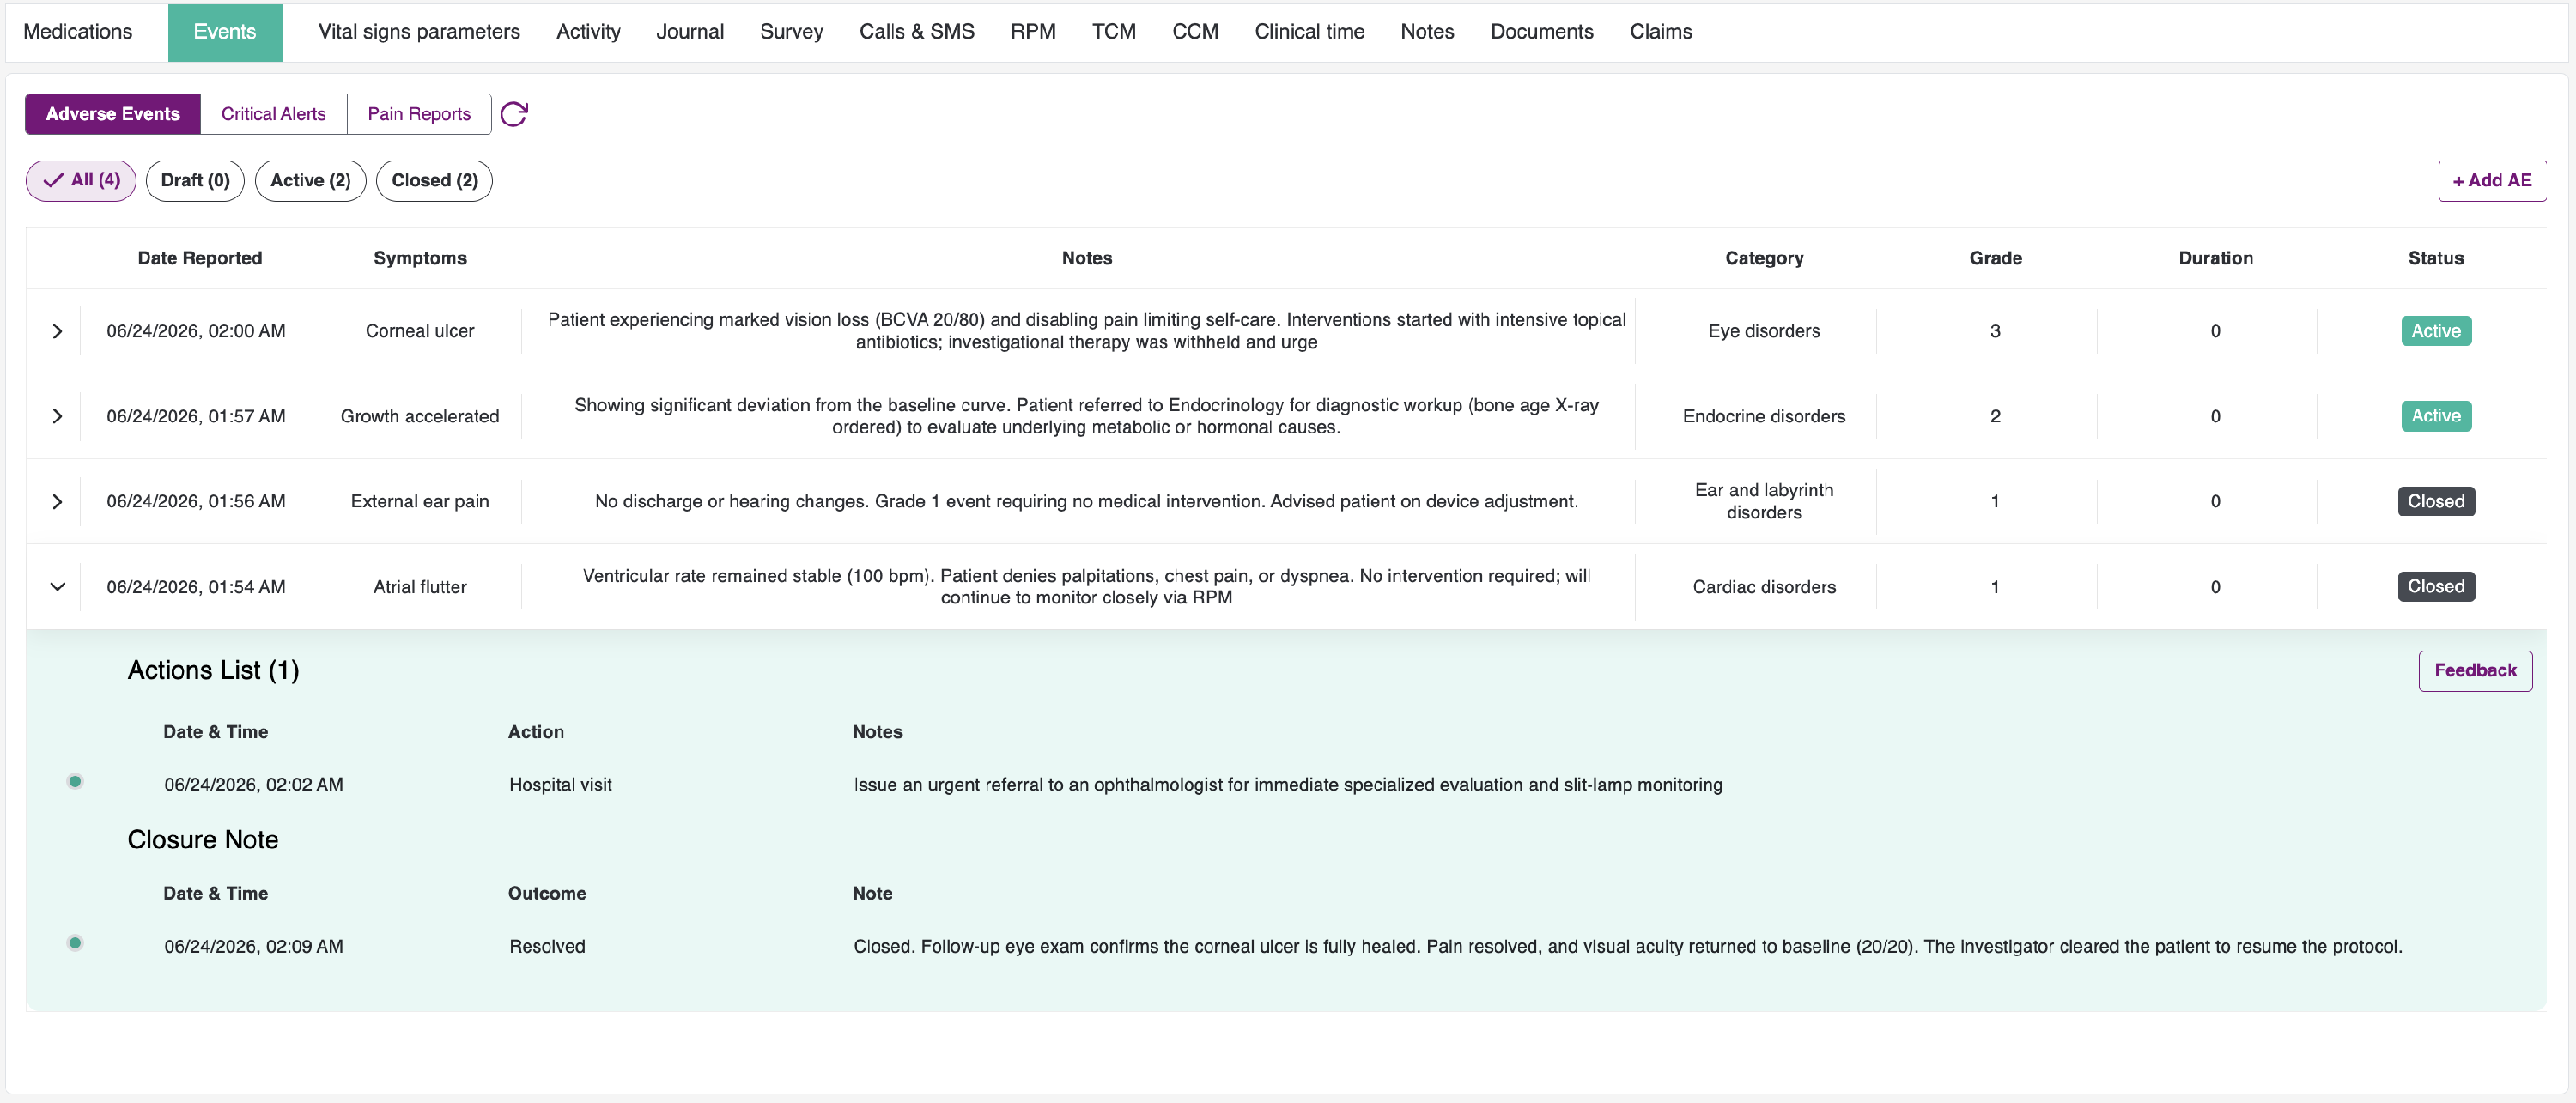
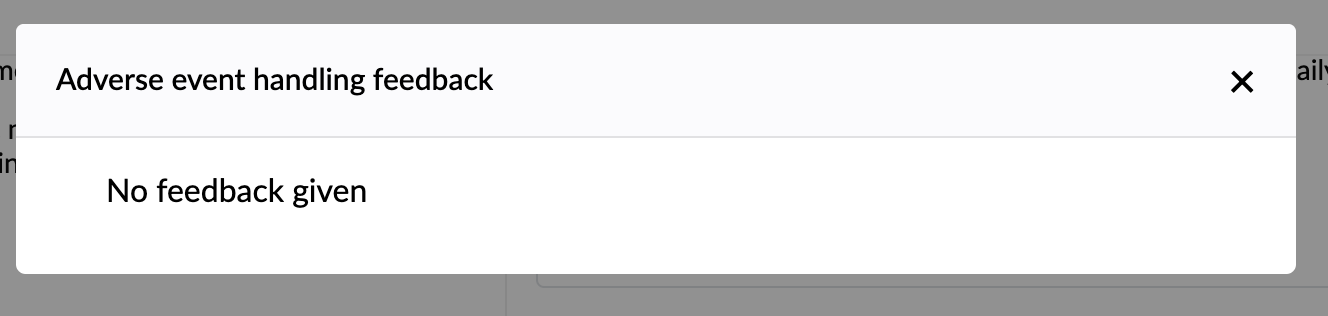
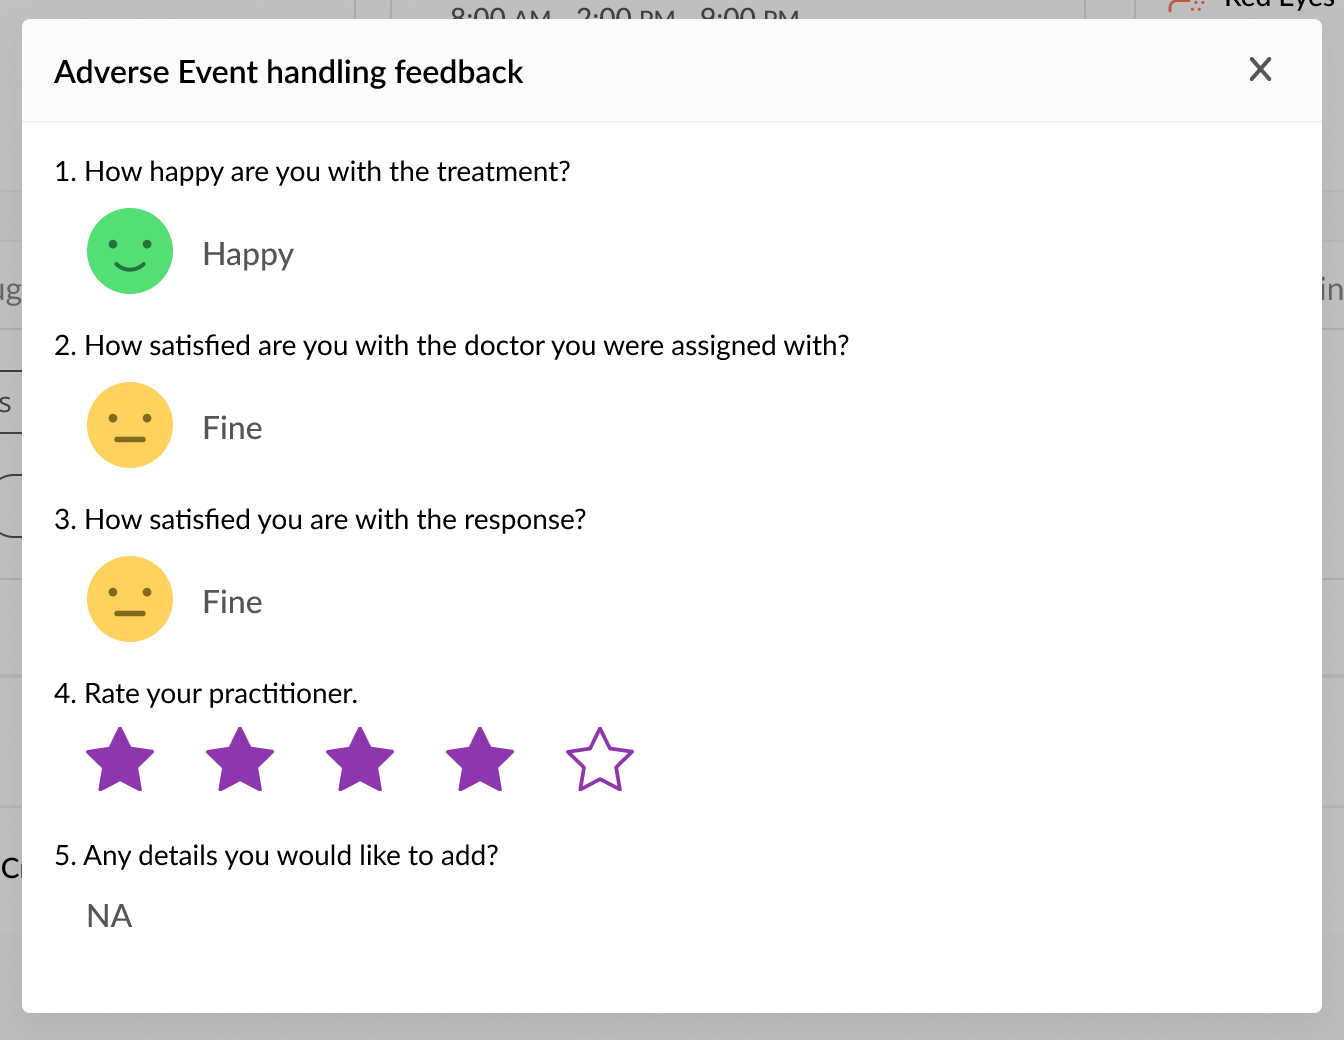
There's a Feedback button at the right, to view the feedback given by the patient for handling the Adverse Event. If feedback is not given, you will see text saying, No feedback given.
- Once the Adverse Event is closed, the status becomes Closed represented with Green color.
Critical Alerts
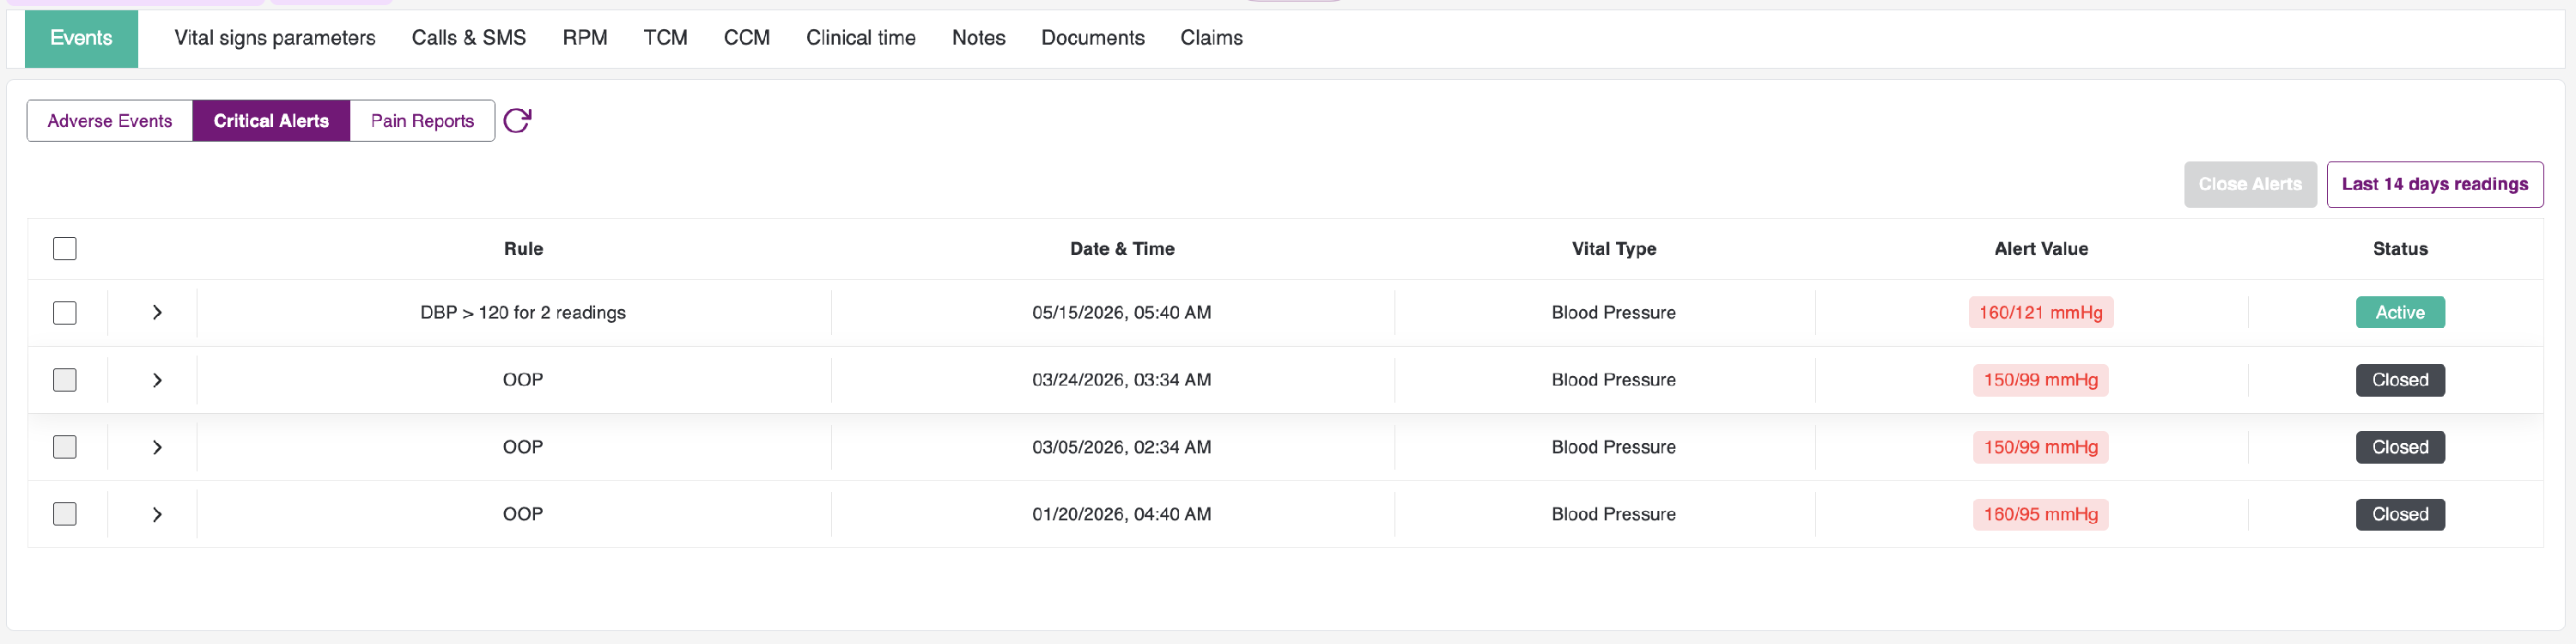
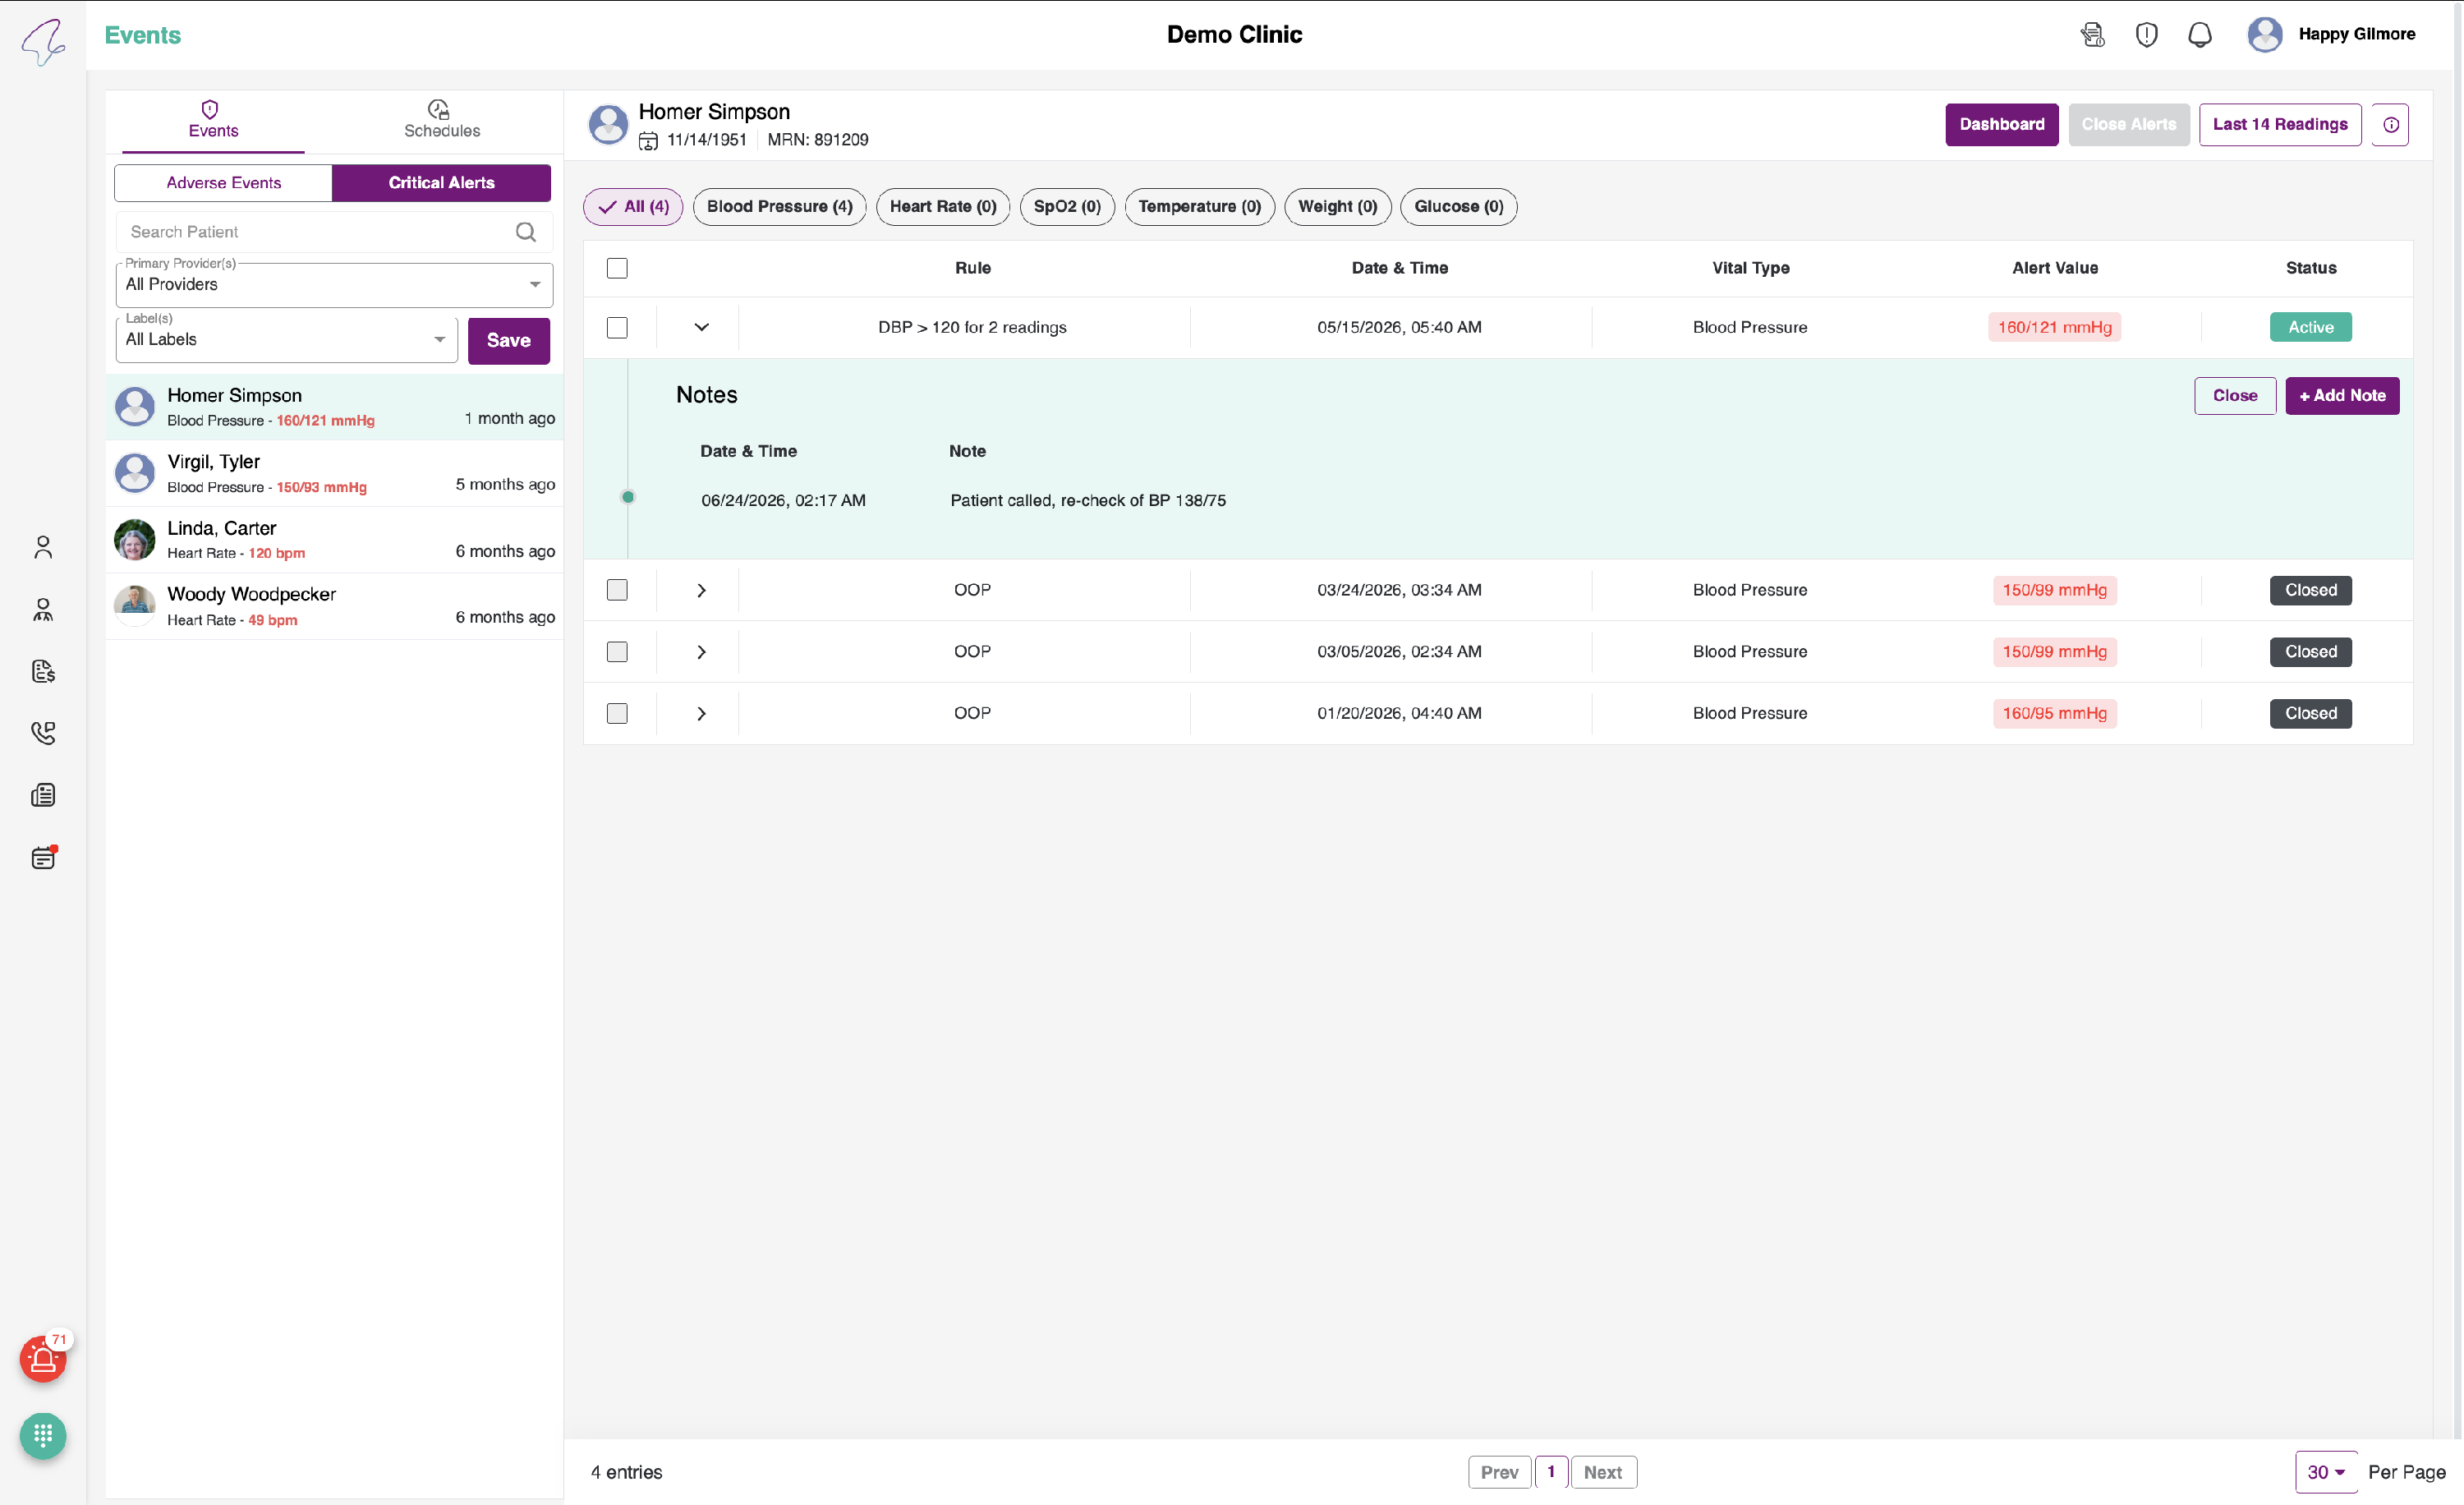
To view Critical Alerts, click on the Critical Alerts tab beside Adverse Events. The following page can be viewed:
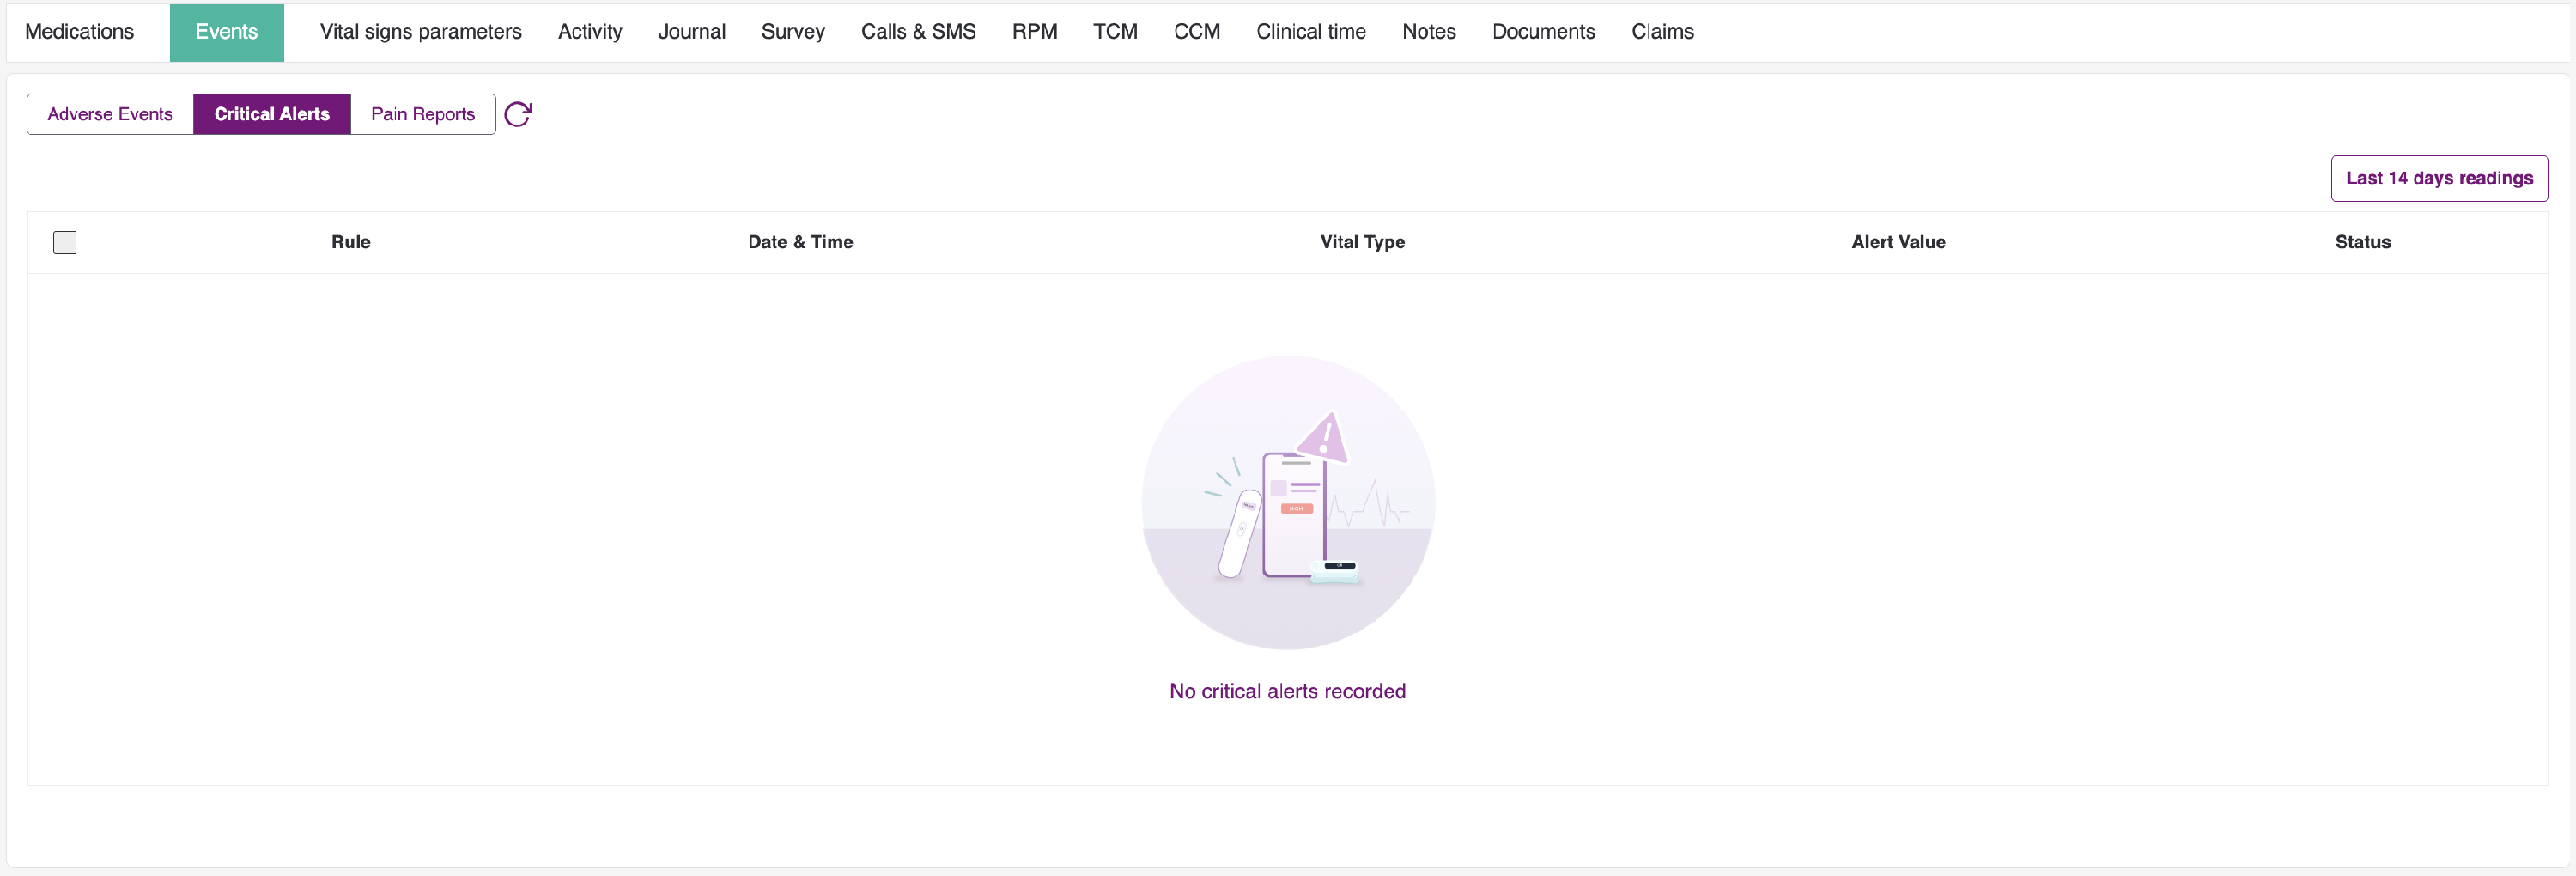
If there are no Critical Alerts raised, then you will view the following screen:
- Rule: Based on which rule the alert is triggered.
- In this table, you can view the Date & Time at which the Critical Alert was generated.
- Vital type: Heart Rate / SpO2 / Temperature / Blood Pressure / Weight.
- Alert Value: Any value below the Min value or above the Max value is considered an Alert Value.
- Status: Indicates whether the critical issue is active or closed (for example, after it has been reviewed and everything is fine, or once the issue has been resolved).
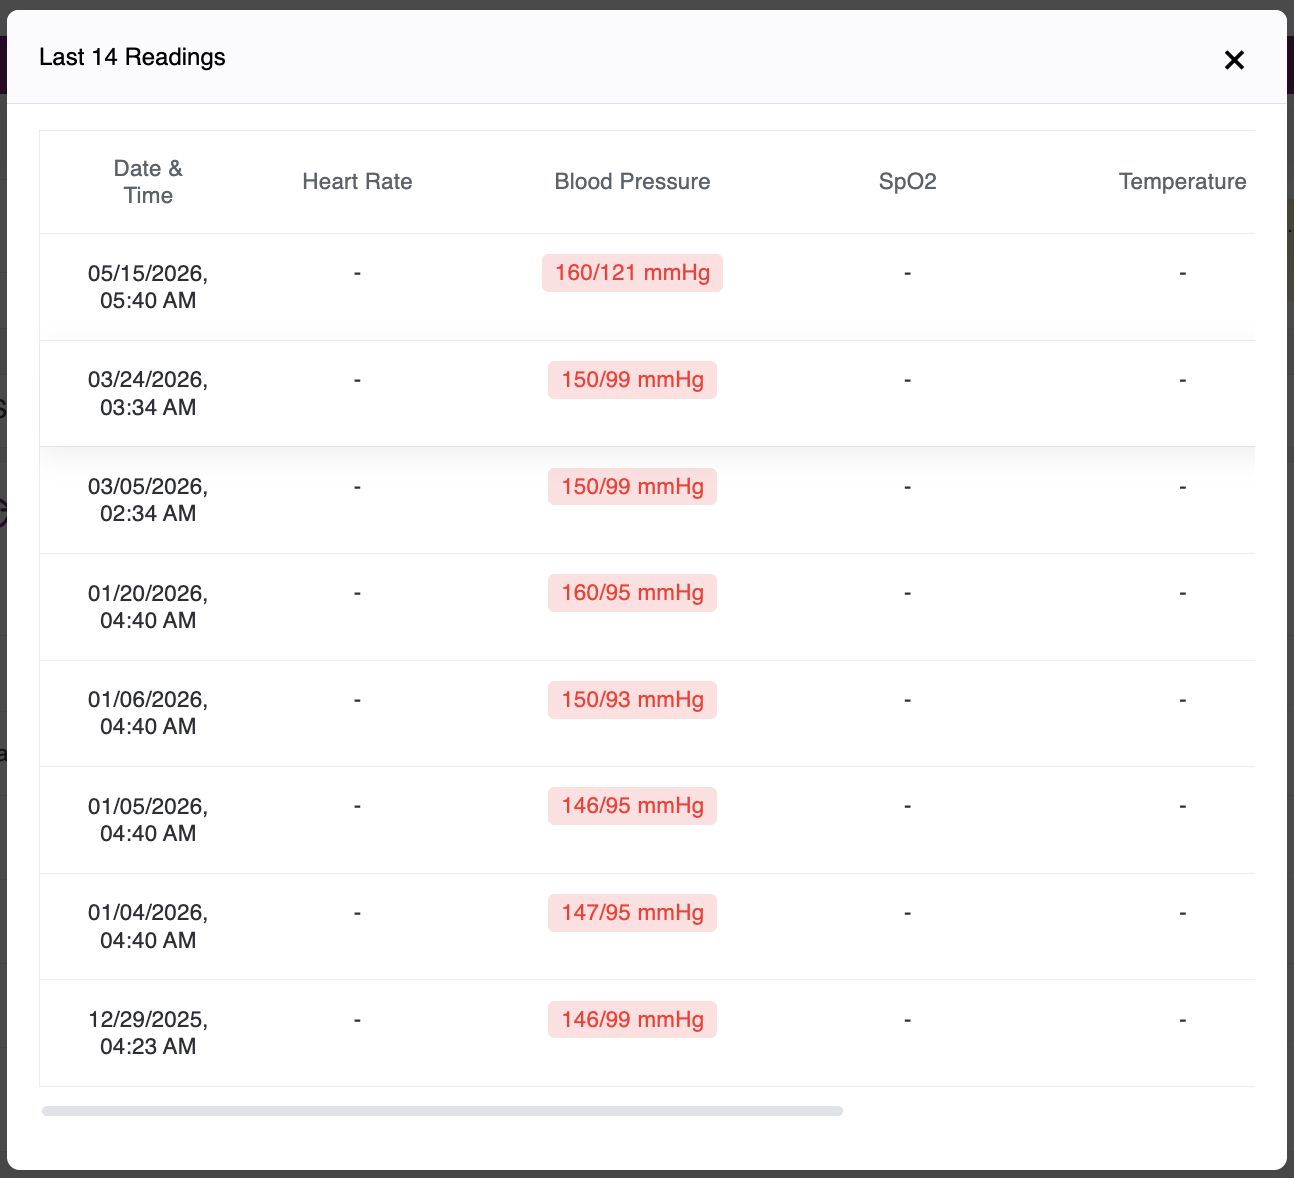
- You can view the patient’s readings from the last 14 days by clicking the Last 14 Readings link located above the table.
- Whenever a patient takes the readings, those readings will be compared against the Min and Max values. If the value falls outside the allowed range, the Critical Alert will be raised and can be viewed here.
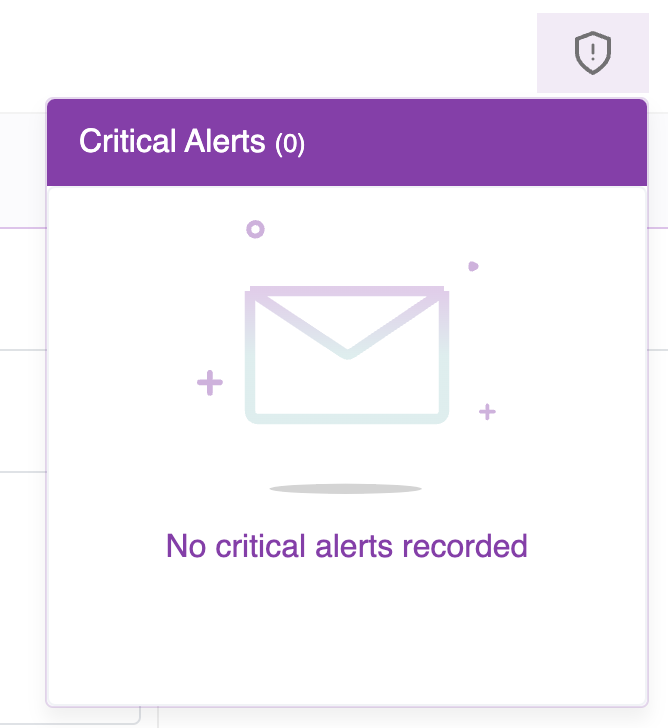
- You will also receive notifications in the header, indicated by a shield icon. If there are no Critical Alerts, you will see it as follows:
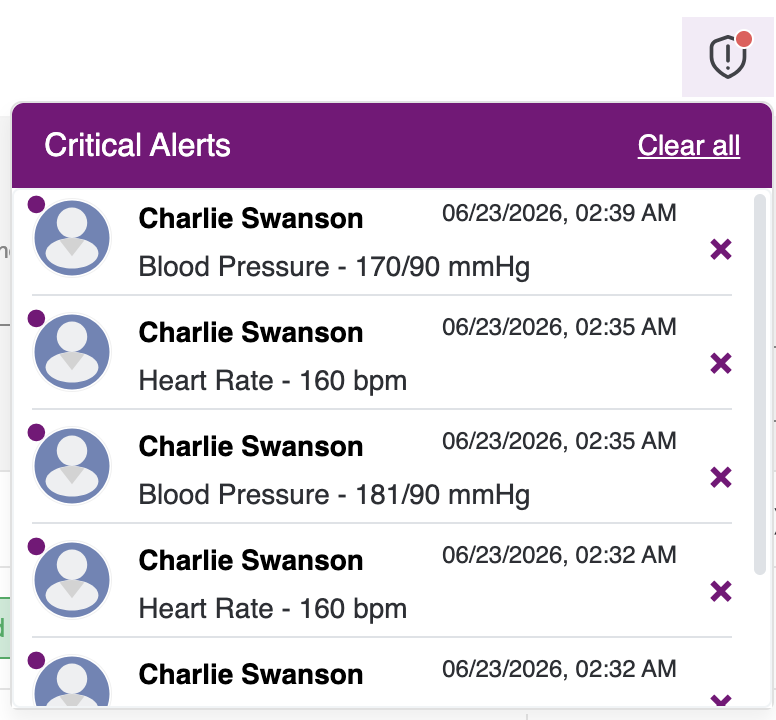
- Once any Critical Alerts are raised, this is how we will be notified.
- When you click View all Critical Alerts, you will be redirected to the chat screens, where you can view the complete list of all patients for whom Critical Alerts have been raised.
- On the left, you can review the readings associated with the most recent Critical Alert raised. On the right, you can view the list of Critical Alerts raised for that specific patient.

Close Critical Alerts:
- You may close alerts either individually or in groups. For each alert that is closed, two minutes of clinical time will be added.
-
Individual Alert Closure:
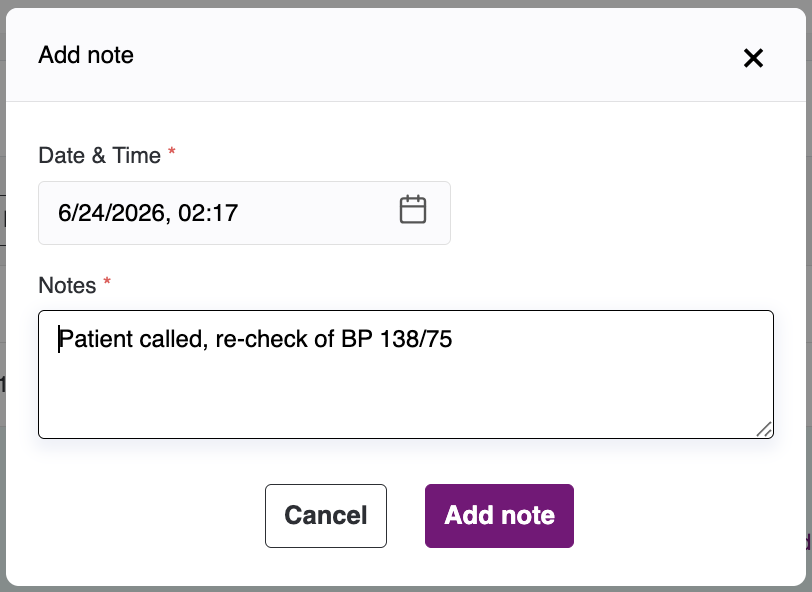
To close an alert, select the specific alert you would like to close. A section will appear beneath the alert with two buttons on the right-hand side: one to close the alert and another to add notes for the alert.
- Close Alert: Once the alert is closed, two minutes of clinical time will be added, and a note will be automatically recorded in the main notes section on the patient dashboard.
-
Add Notes: Use this option to add notes specific to the selected alert. These notes will remain associated only with this critical alert and will not appear in the patient’s main notes or on the patient dashboard.
Multiple Alert Closure:
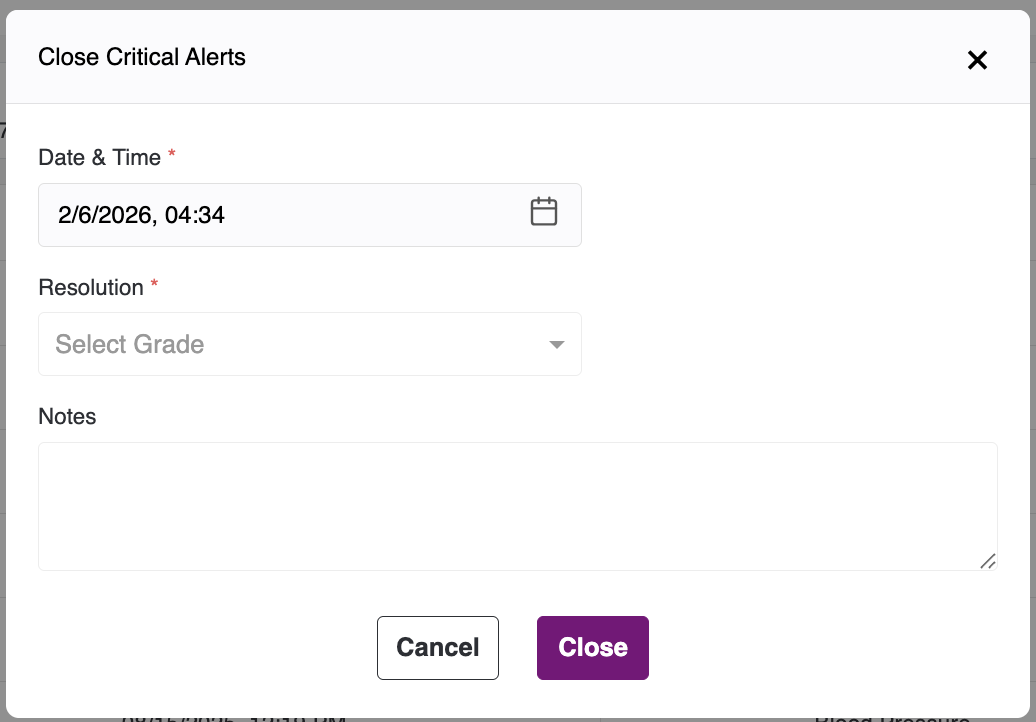
To close multiple alerts at once, please select the checkboxes next to the critical alerts you wish to close. Then, click the Close Alerts button located beside the Last 14 Readings button in the top-right corner.
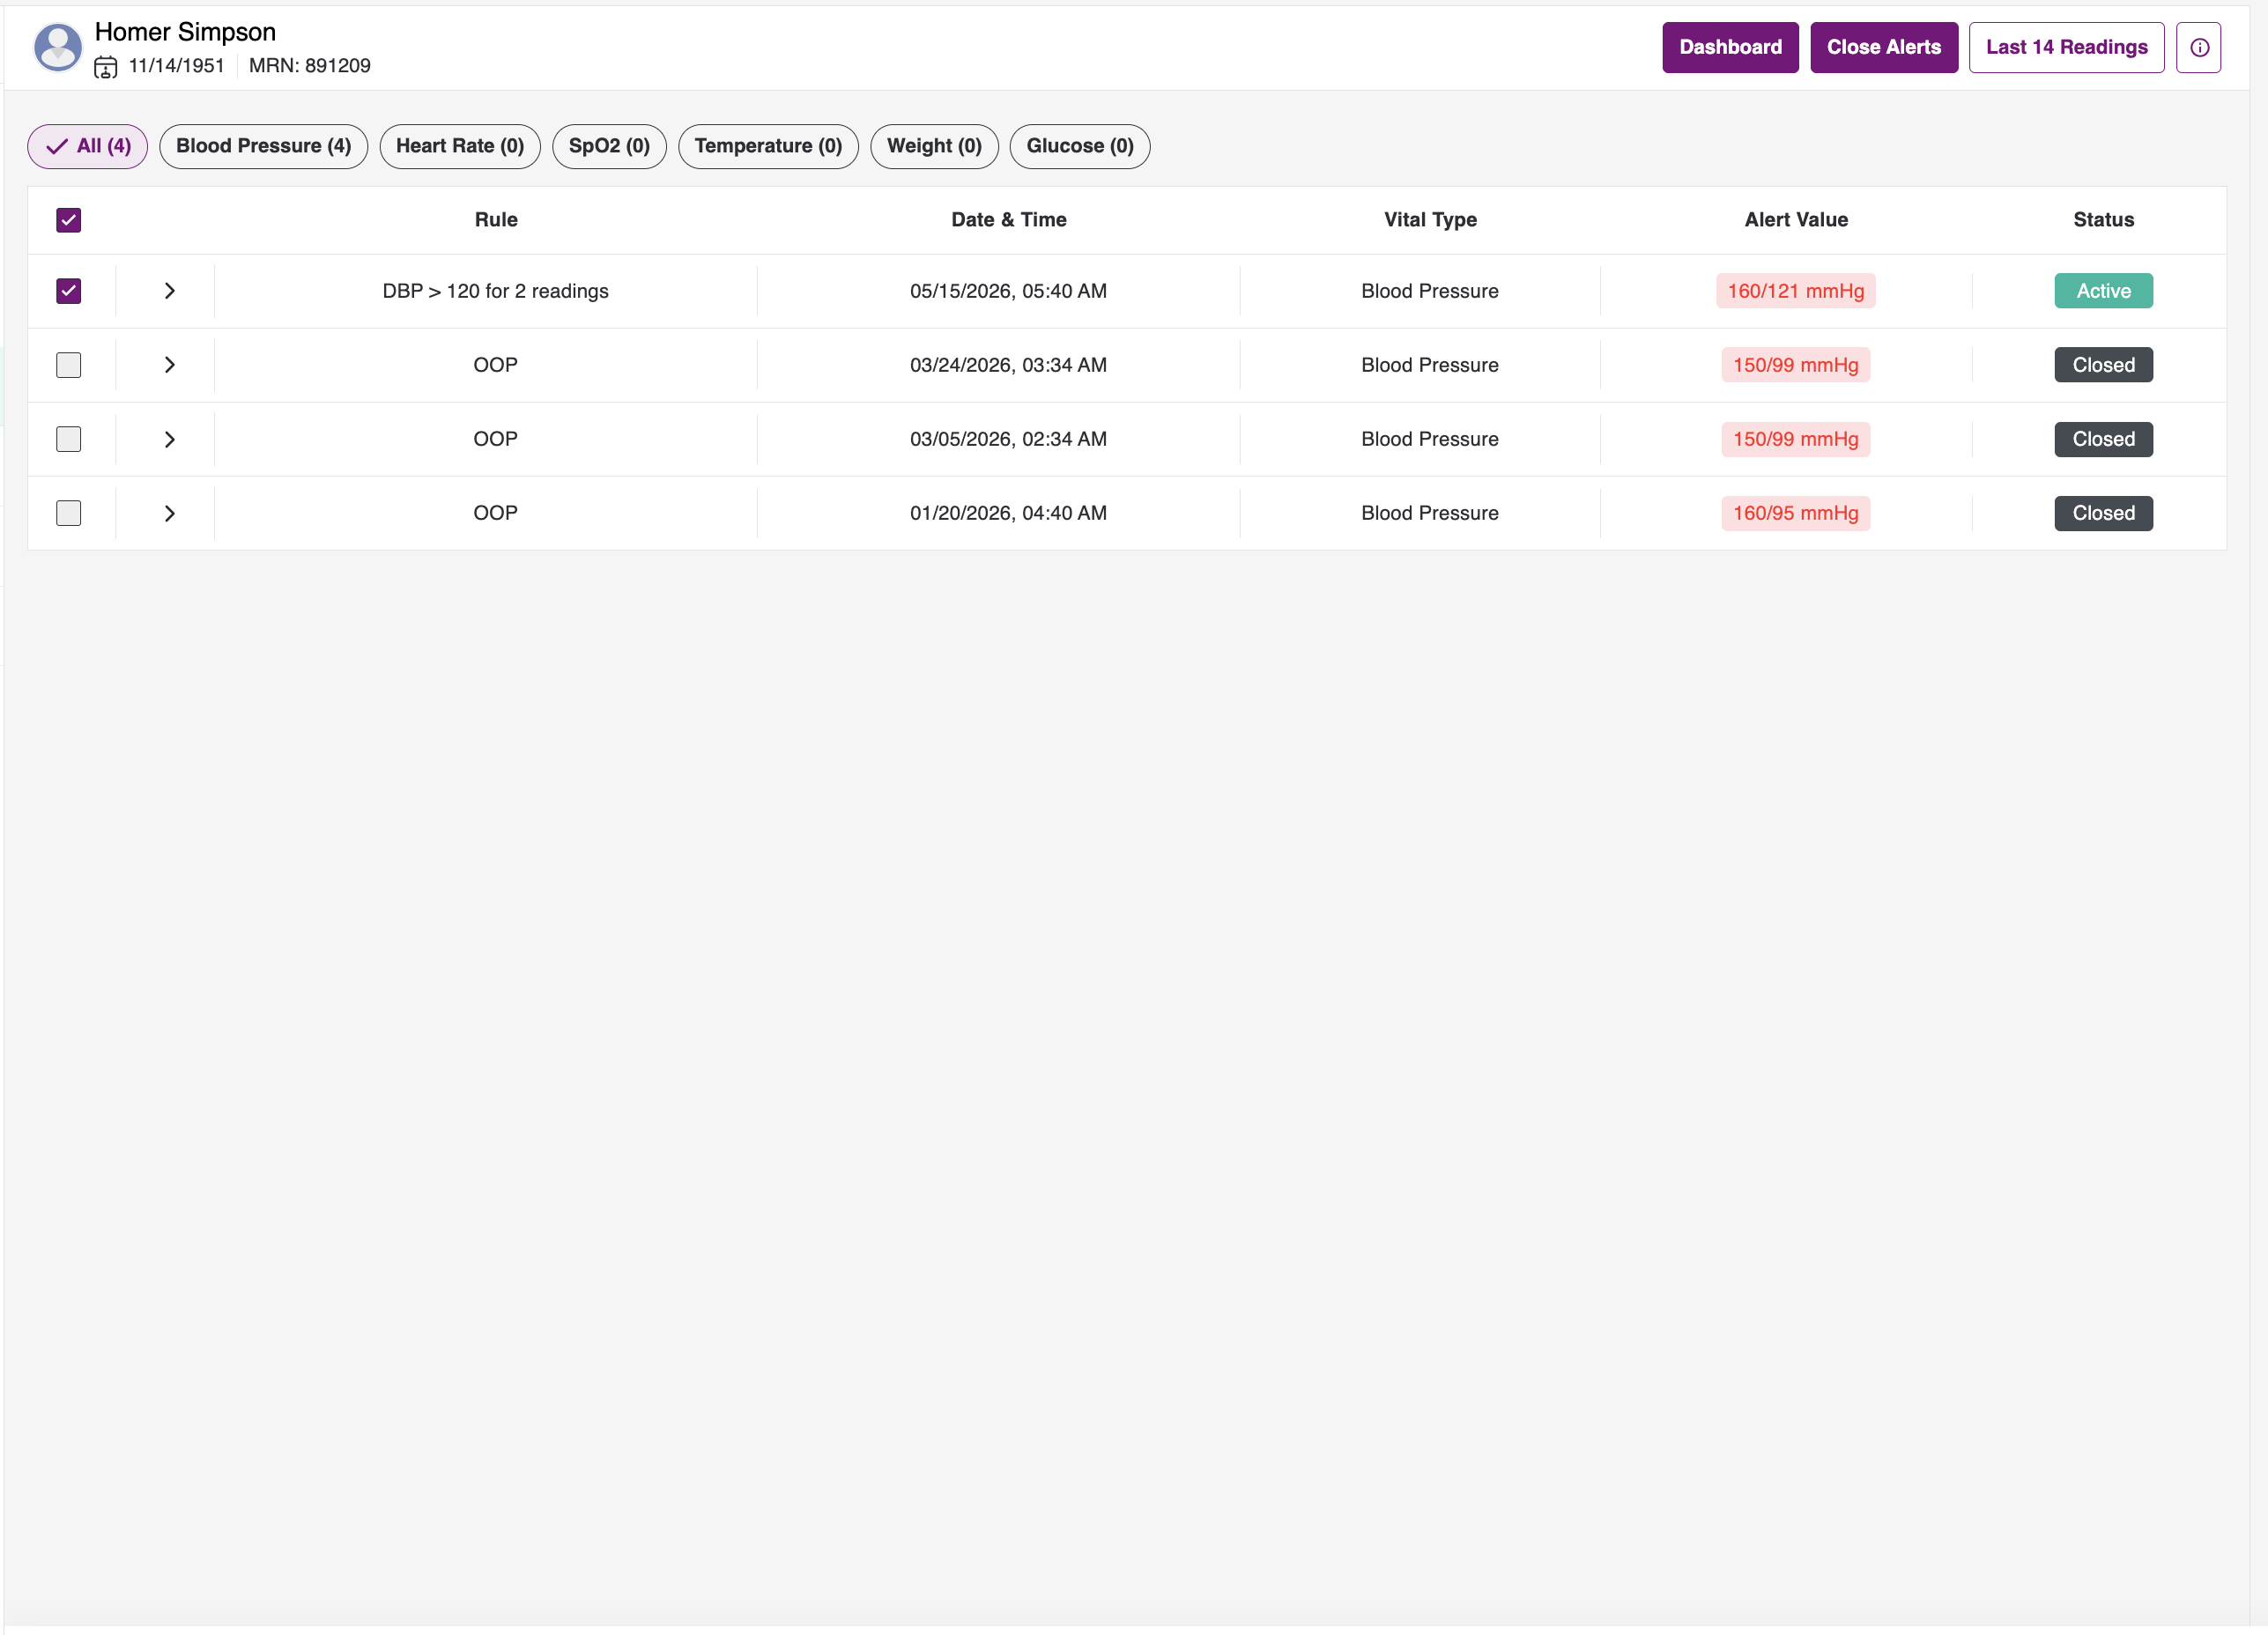
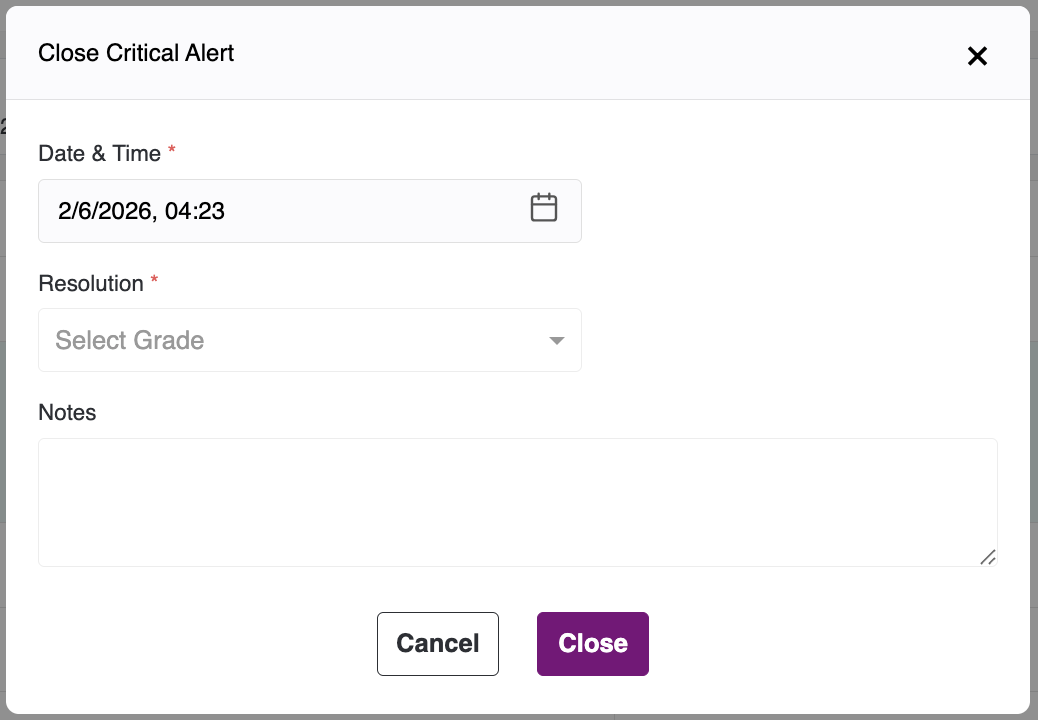
When you click this button, a popup will appear. Please complete all mandatory fields and then select Close. The alerts you selected will be marked as closed and moved to the end of the list. For each alert that is closed, two minutes of clinical time will be added, and an associated note will be recorded in the main notes section on the patient dashboard.


Pain Reports
- To view Pain Reports, click the tab next to Critical Alerts. The page will then display an Empty State.
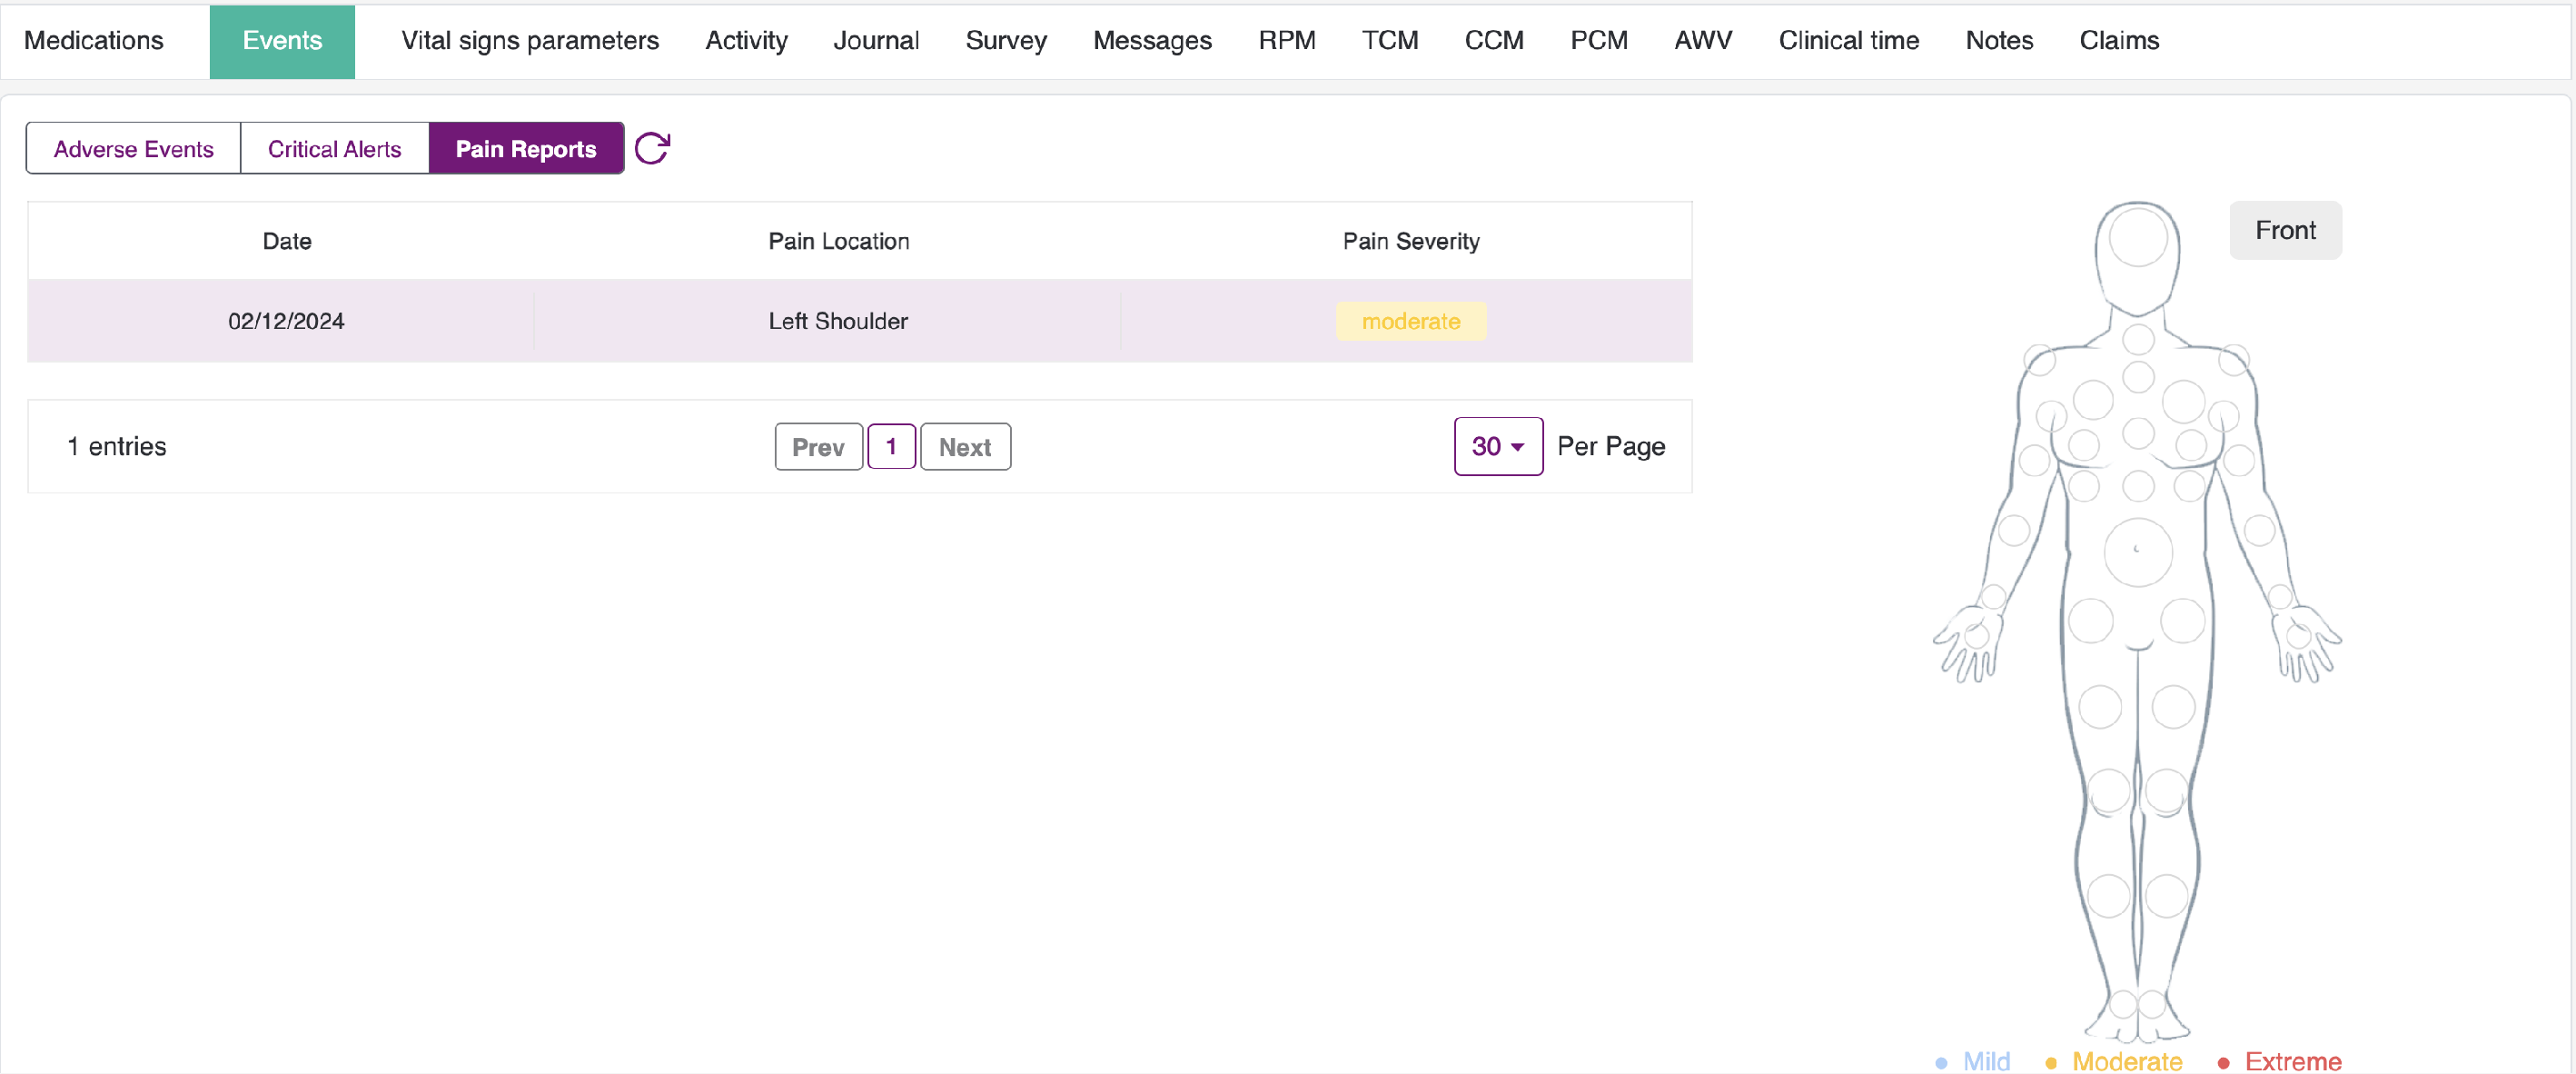
- Here, you can view the list of pain reports submitted by the patient in the table, including the following details: Date, Pain Location, and Pain Severity.
- In addition, a body map is displayed beside the table in two views: Front and Back.
- Whenever a patient reports a pain point, they will be prompted to select the pain location and its severity from the available options: Mild, Moderate, and Extreme. After the patient submits their selection, the recorded entry can be viewed here.
- For more details, click any record. The pain location will then be highlighted on the body map as shown below. In this example, the pain point location is Head and the severity is Moderate.
- In the example above, the pain point is Head and the severity is High. You can also see how, based on the pain point location, the body map view switches between Front and Back.
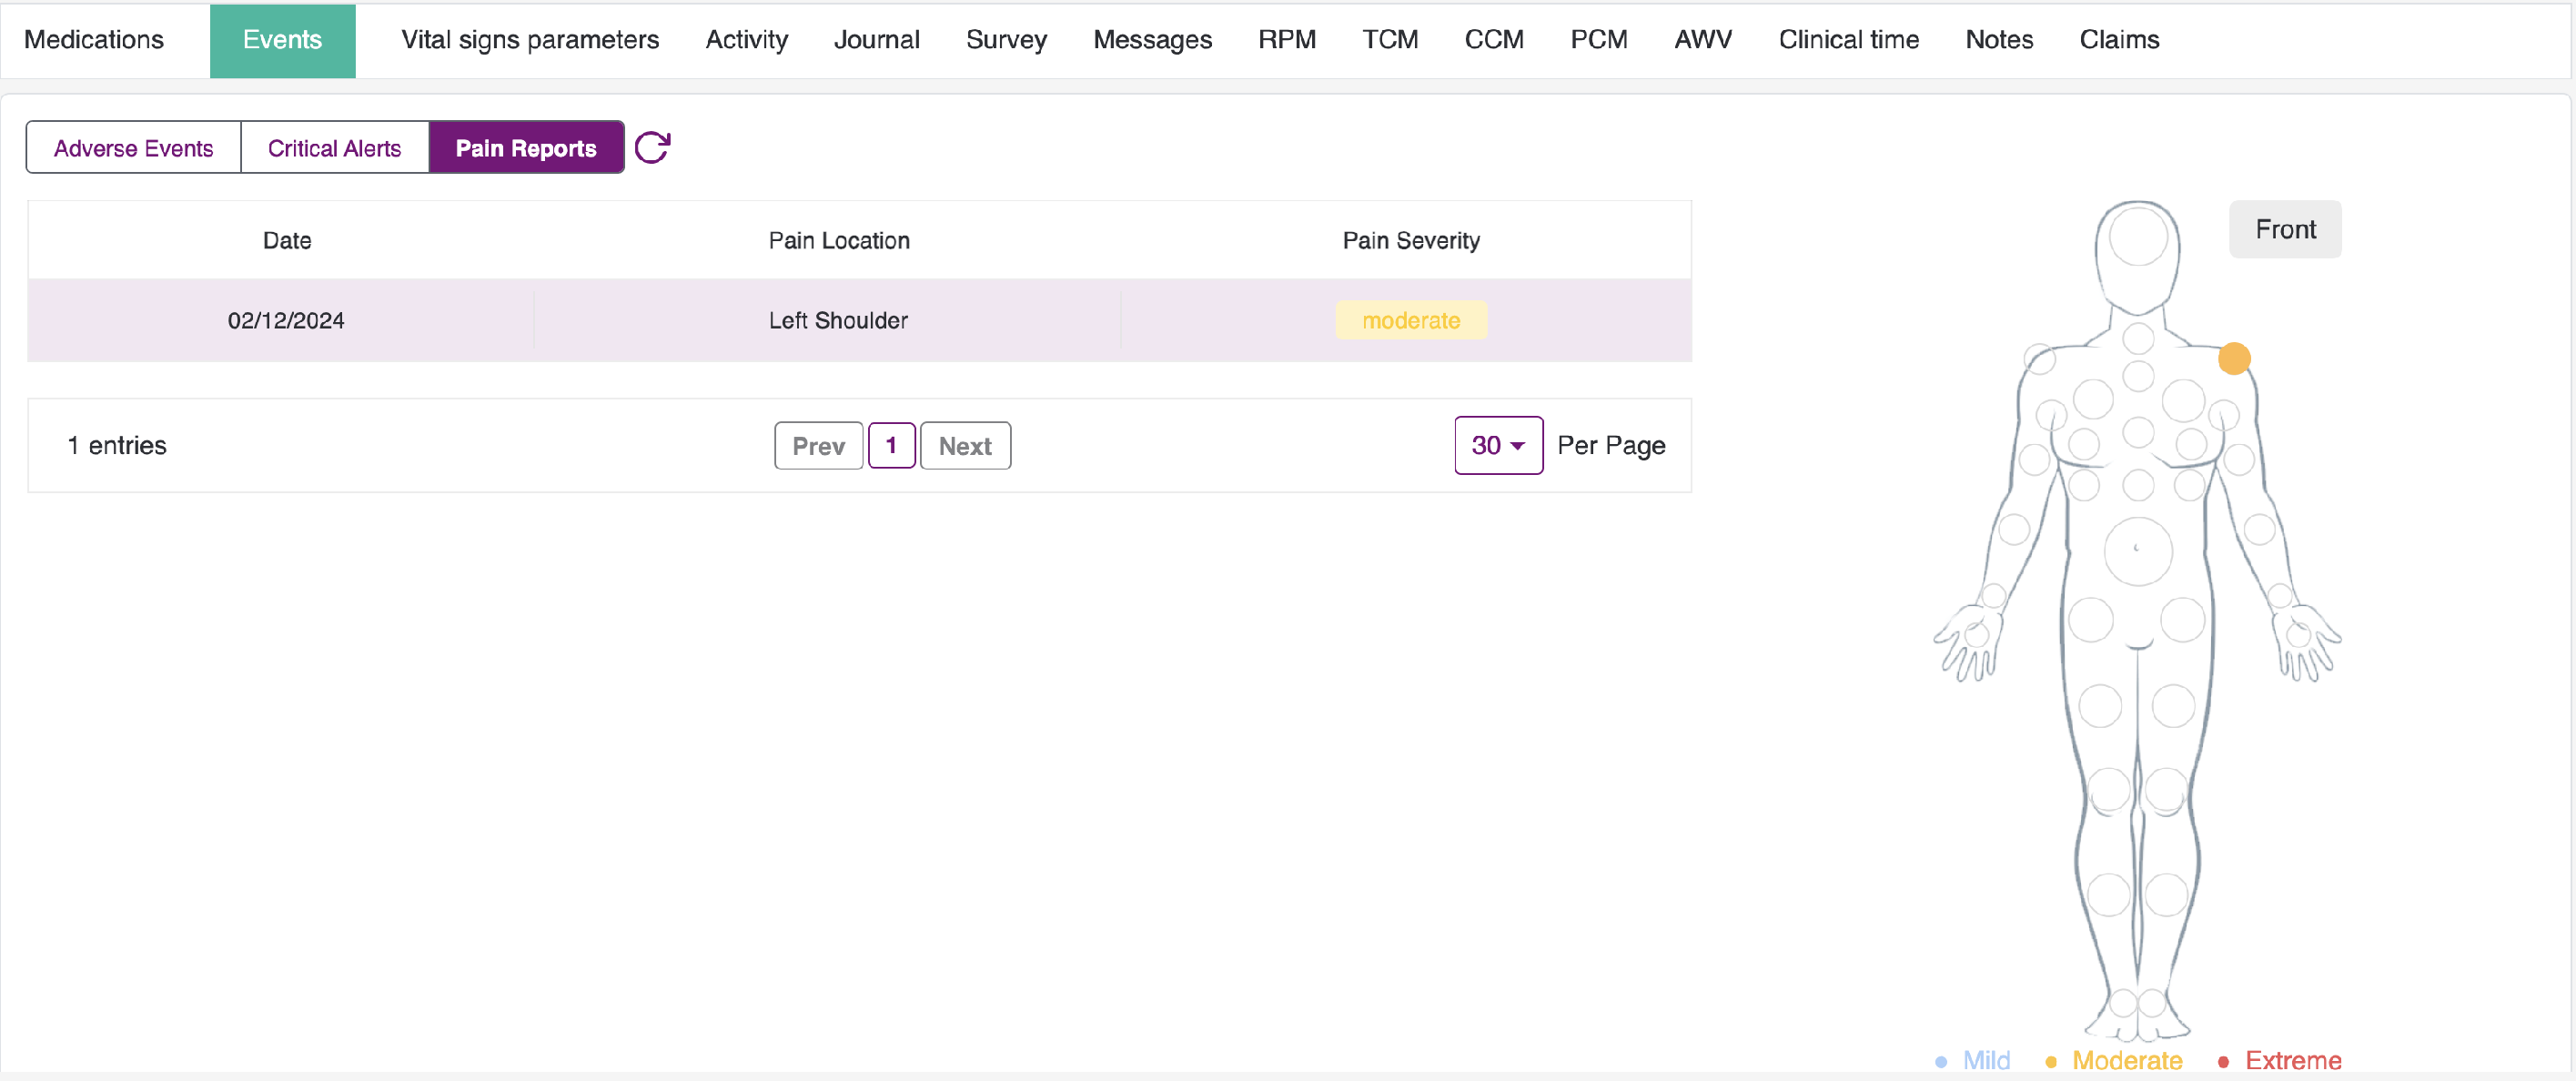
The Severity can be represented as follows:
- Mild - Light Blue Colour
- Moderate - Amber Colour
- Extreme - Red Colour
Note: Both Adverse Events and Pain Reports can be refreshed by clicking the refresh icon next to the tabs on the left.